
Part one got the radio working. Now the node had to talk to a sensor, and there was a problem: the actual sensors were installed on site.
The node firmware polls the sensor over RS485 and pushes the readings up over LoRa. But to develop and verify that polling logic, something has to answer. Going to the site to write code was not an option.
So we built a program that pretends to be a sensor. It opens a serial port, waits as a slave, and responds like the real device whenever a master issues a read or a write.
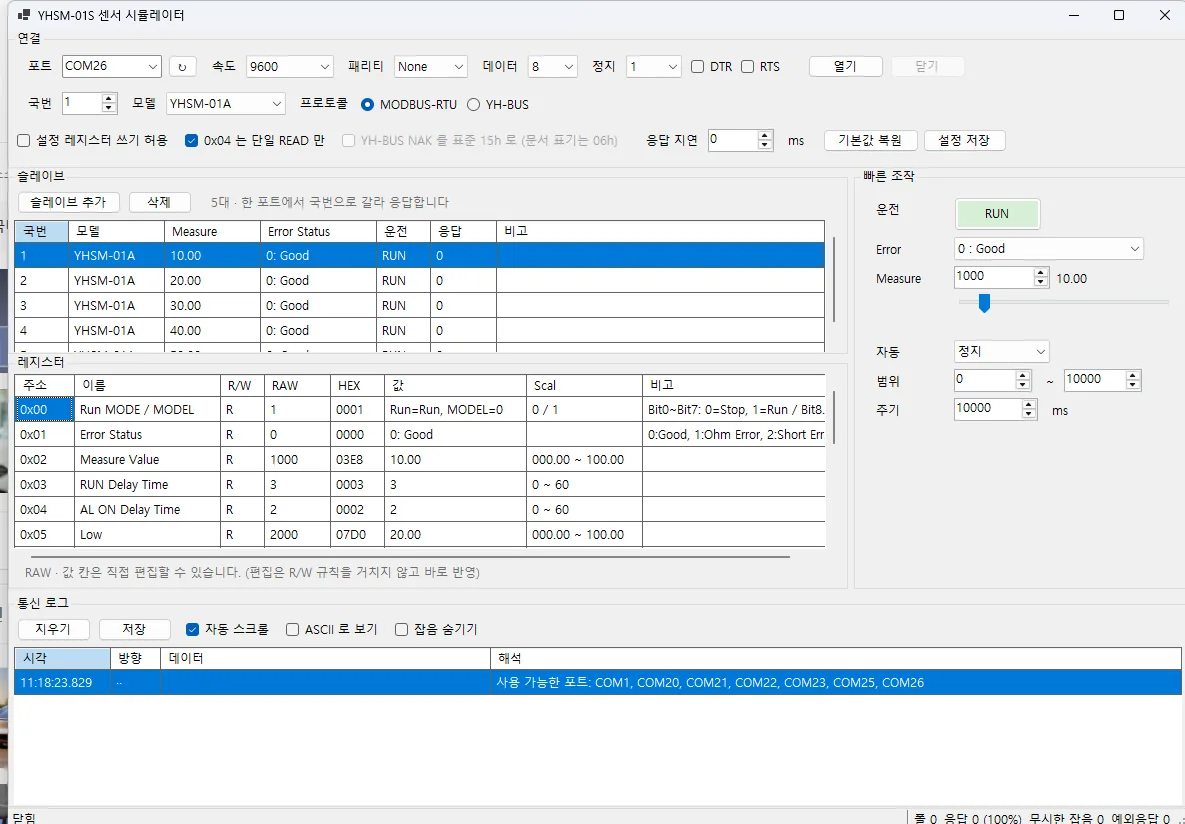
Connection settings, slave list, register table, quick controls, and the traffic log. Everything a single sensor has to do, on one screen.
Several Modbus slave IDs on one port
One RS485 port with several slave IDs is how the field is wired: one node addresses several sensors on the same bus by slave ID. The simulator therefore had to play several sensors with different IDs on a single port at once.

IDs 1 through 5 each hold their own measurements. The right-hand panel switches RUN/STOP, error state, and the measured value instantly, and can drive automatic variation with sine, ramp, or random patterns.
The reason this mattered: exception handling on the master side cannot be verified with normal responses. Does the loop keep servicing the other four when one sensor stops answering? What does the upper layer do when a device reports an error state? Those cases are tedious to reproduce with real hardware, and here they are one click away.
Registers follow the document’s address table exactly
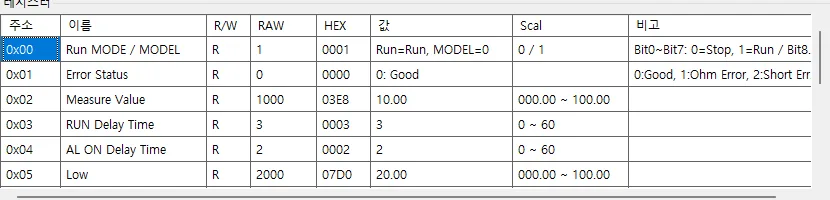
Address, name, read/write permission, RAW, HEX, decoded value, and range. Edit the RAW or value
cell directly and it takes effect immediately.
Direct register editing was deliberate. It lets us force a state that cannot be reached through the normal path, then watch how the master reads it.
Four places where the protocol document disagreed with itself
The protocol document from the manufacturer was what we implemented against. While doing so we found four places where a stated total and the field table below it did not agree — inside the same document.
For example, the length of a normal read response is written in the prose as 6 + 2N, but adding up
the field table directly beneath it gives 5 + 2N. Which one is right?
We took the field table every time, for one reason: a total only has to be wrong in one place to stay wrong, whereas the field tables cross-check against each other across responses. And in fact, other command responses in the same document matched the field-table arithmetic.
One item we followed the document on anyway. The exception response code was written as a value that differs from the standard, and since the goal is to reproduce the real device, not the standard, the document won. We did leave a checkbox to switch to the standard value, and flagged the item as one to confirm with the vendor.
When a real device behaves differently from its document, the upper-layer program passes against the simulator and breaks in the field. That is why a simulator must not lie. Anything we were unsure about got a visible switch rather than a quiet decision.
The serial silence timer that split one good frame in two
Serial frame boundaries do not exist. Where one request ends is decided by a rule: a period of silence means it is over. We set that silence threshold far too short at first.
Because of USB converter latency, a single frame arrives in two chunks, and our timer fired in the gap between them — so one valid request turned into two corrupted frames. The log showed the first half as a CRC error and the second half as a nonsense slave ID.
Reading the log alone, the bus looks faulty. It was a ghost created by our own timer.
While fixing it we made the length hint three-state.
| Value | Meaning |
|---|---|
| Positive | The length of this frame is known |
| 0 | Not decided yet |
| Negative | Cannot be decided |
Collapsing “I do not know yet” and “I cannot tell” into one state means that when only the first byte of a frame has arrived, the whole thing gets cut. The two states had to be separated.
Separating an RS485 bus problem from our own code
The first byte arriving corrupted or missing entirely went on for a while. The first question was whether this belonged to the simulator or to the bus.
The method was simple. We took the simulator out of the picture and opened the port directly from PowerShell to read raw bytes. The same symptom appeared. So it was not our code.
We believe the cause is RS485 transmit/receive direction switching latency. But the important part was not the cause itself — it was that proving “not my code” takes five minutes. Skip those five minutes and you spend hours hunting someone else’s problem inside your own source.
Nailing it down with regression tests
Regression tests pin both of the bugs above: a frame that arrives split is not truncated, a stray noise byte does not attach itself to the next request, and values stay isolated per slave ID. There are more than a hundred tests.
A simulator is ultimately a tool for trusting other code. If the tool is quietly wrong, the entire verification effort is meaningless. This is the one place where we did not economize on tests.
A diagnostic mode that runs without a window
Diagnostic mode is for when all you need to check is wiring, baud rate, or slave ID. Launching a GUI is itself a chore then, so this mode opens the port with no window, answers for a set period, and writes a log. The exit code distinguishes the outcomes: answered, nothing received, or port could not be opened.
Out in the field with a single laptop, this was the fastest way to answer “is this line alive?”
A simulator is a tool for trusting other code, so if the tool is quietly wrong the entire verification effort is meaningless.
▶️ Next in this series — the poller that does not wait: With the sensors covered, the question became how many devices we could attach. Waiting for each reply took 42 seconds for 30 devices.
🔧 Previously: silence with no CRC errors, and the sync word behind it.
Contact
- Email: [email protected]
- Instagram: https://www.instagram.com/going.sen/
- Website: https://intosen.com/kr/consult/
Comments
Enter a nickname to leave a comment, or sign in with Google or GitHub.