
Part 5 was about the AI writing ladder logic. This one is about diagnosis. I planted a fault in a running PLC on purpose and let the AI find it and fix it. Here’s how that went.
The yardstick for building the diagnosis was how a field tech hunts a fault. There’s an order you check values in. There are boundaries you don’t cross carelessly. And before any experiment, you predict first. I moved that way of working into documents and tools and handed it to the AI.
Setting up the test went like this. I built a transfer line that worked, then flipped one contact the wrong way. Then I opened a fresh AI session that knew nothing about it. The one who planted the fault stayed out until the diagnosis was done. If someone who knows the answer is coaching from the sidelines, it isn’t a test.
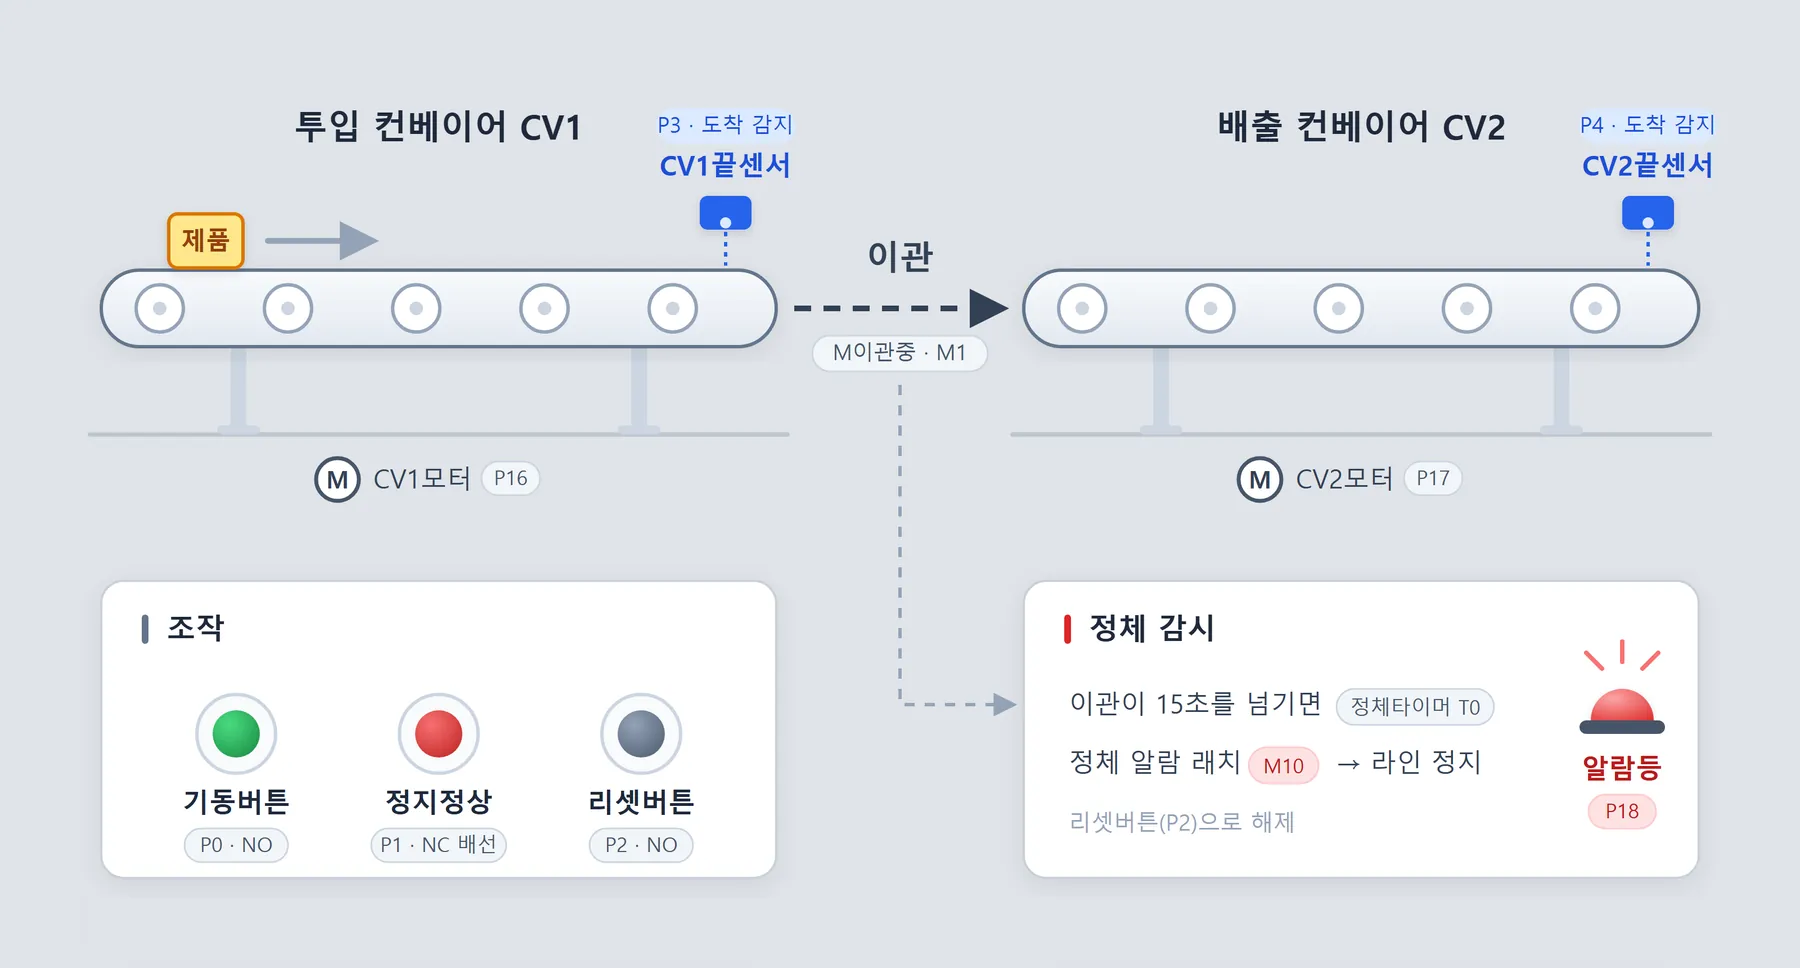
The Line
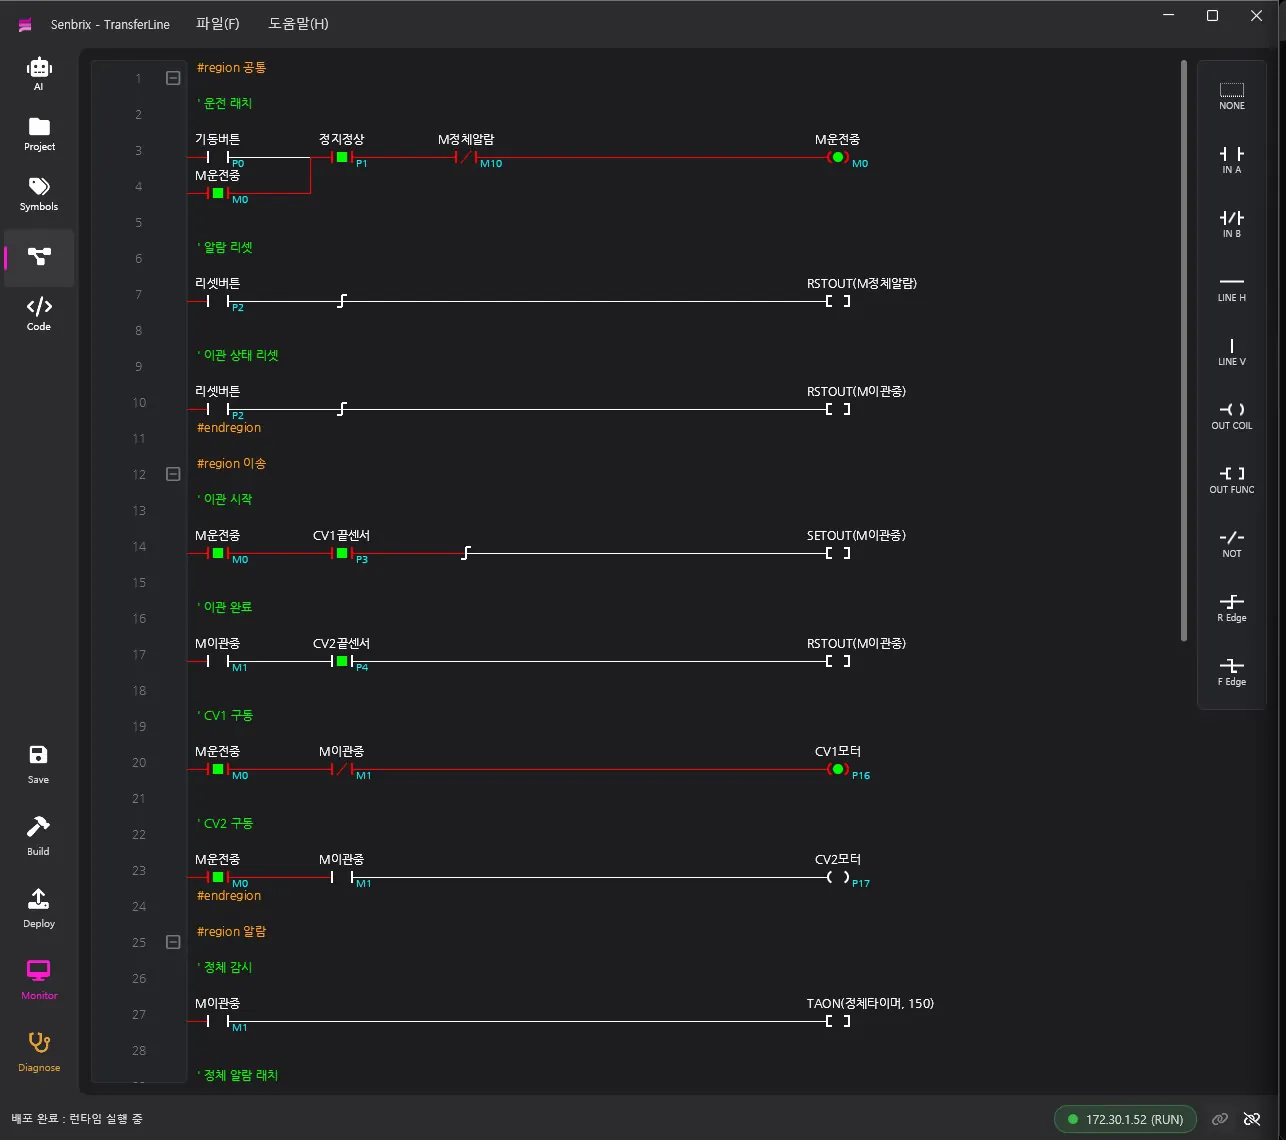
Two conveyors carry product in sequence. The infeed conveyor CV1 runs product to its end, an arrival sensor picks it up, and the outfeed conveyor CV2 takes over. If the handover takes longer than 15 seconds, a jam alarm fires and the line stops. There are start, stop and reset buttons, and the ladder is 10 rungs. This is a desk verification setup running on a local runtime with no physical board, so sensors and buttons are driven by forcing values directly. When the AI runs its verification experiments later on, it uses the same method.
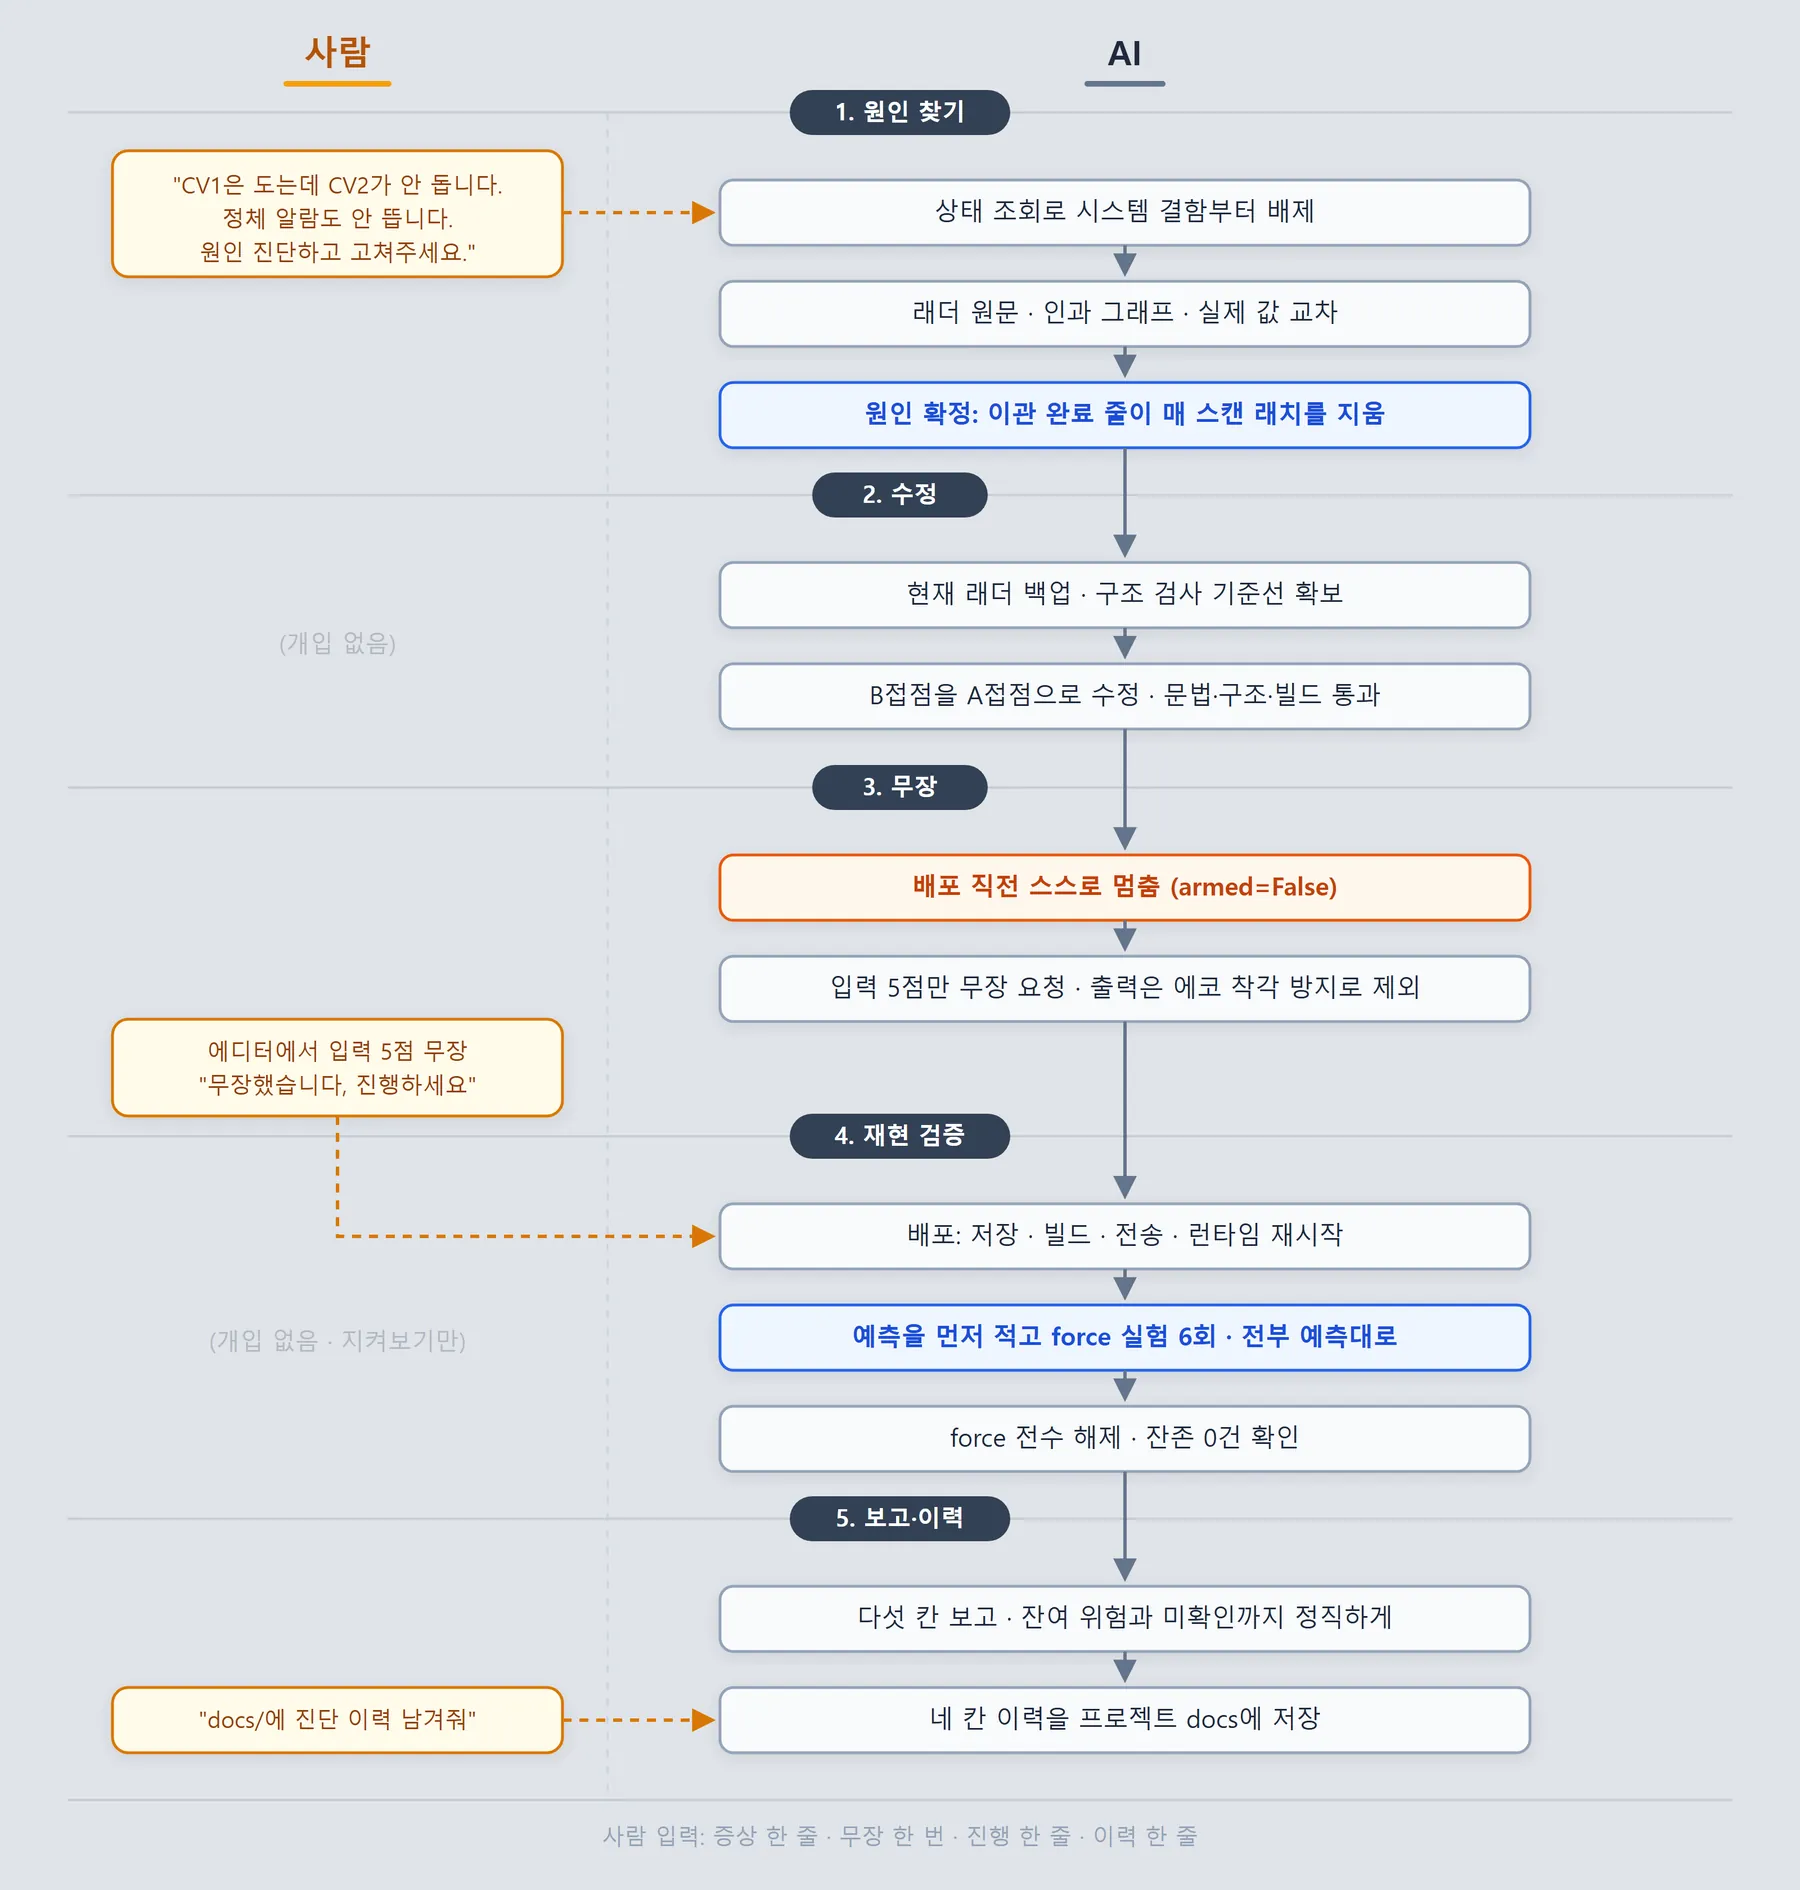
The Whole Flow
The diagnosis ran in five stages. On the right of the diagram is what the AI did; on the left, the points where a human stepped in.
Finding the Cause
I opened the Claude console in the editor and typed a single line of symptoms.
User → AI
Desk verification of TransferLine. Local runtime, no physical board, sensors and buttons simulated with force. When I start it, CV1 runs, but when product reaches the end of CV1, CV2 does not run. No jam alarm either. Diagnose the cause and fix it.
The first response wasn’t a ladder analysis. It declared the procedure it would follow and checked the runtime state first.
AI → User
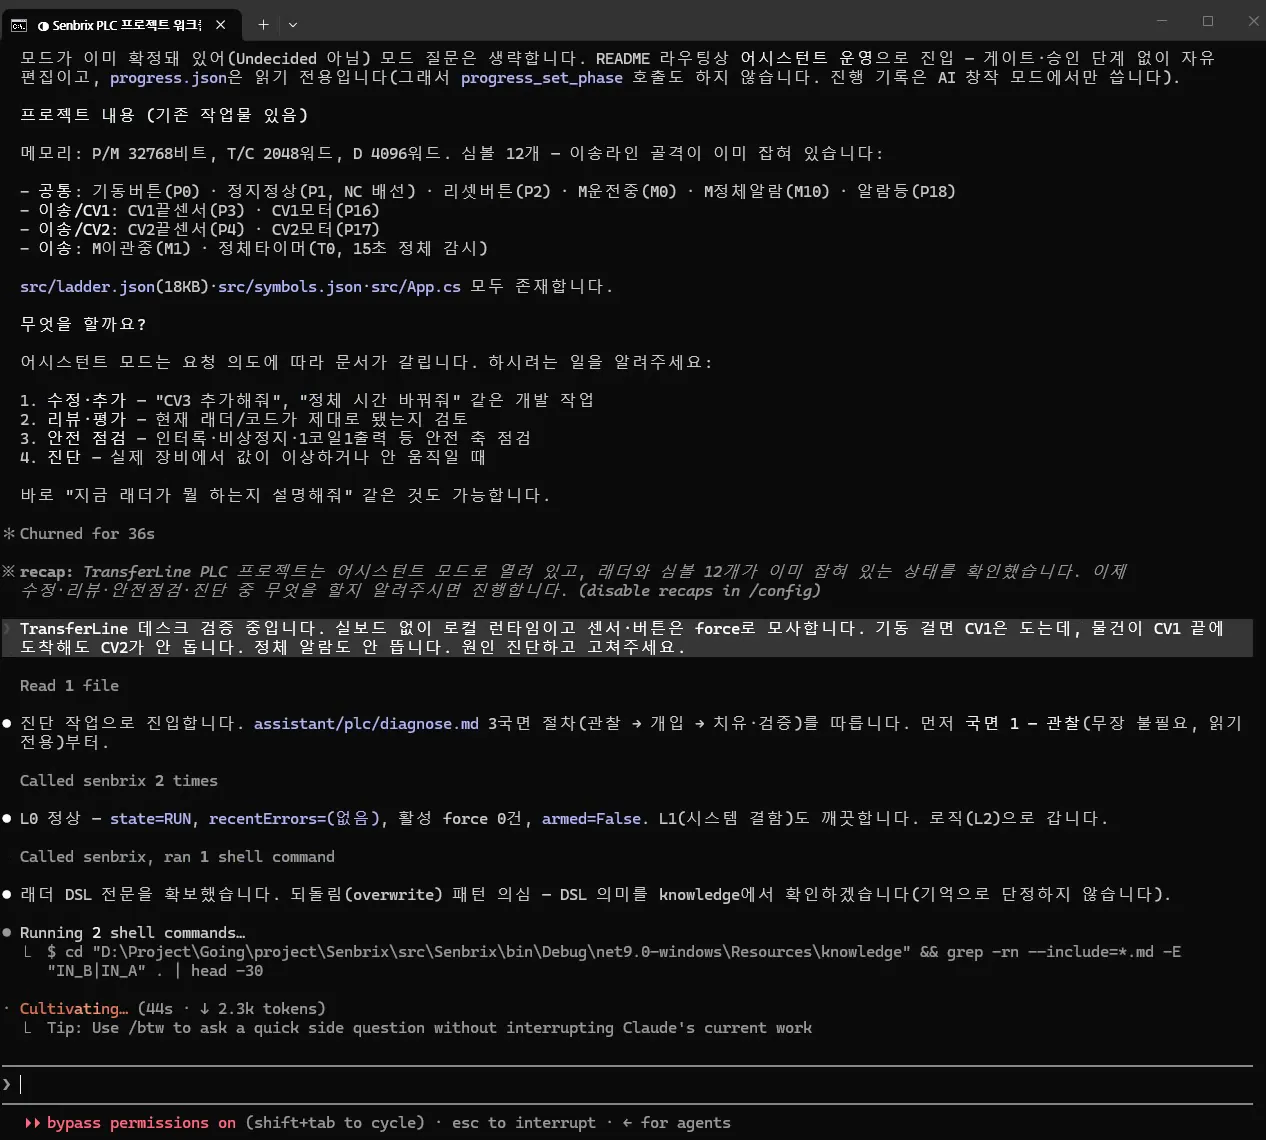
Entering diagnostic mode. Following the 3-phase procedure (observe → intervene → repair and verify). Starting with Phase 1 — Observe (no arming needed, read-only).
L0 normal —
state=RUN,recentErrors=(none), 0 active forces,armed=False. L1 (system faults) is clean too. Moving down to logic (L2).
Half of all field problems come from communication or hardware, not logic. So I set the order: runtime first, then comms, then the board, and only then down into logic. The response above is that order.
Once it got down to logic, the AI pulled the whole ladder, read it, and wrote this.
AI → User
Got the full ladder DSL. Suspect an overwrite pattern — I will confirm the DSL semantics in the knowledge base (not assuming from memory).
The Part 5 rule, only use what you know, carries into diagnosis. It wouldn’t even assume what a contact symbol means from memory. It confirmed it in the built-in docs and then moved on.
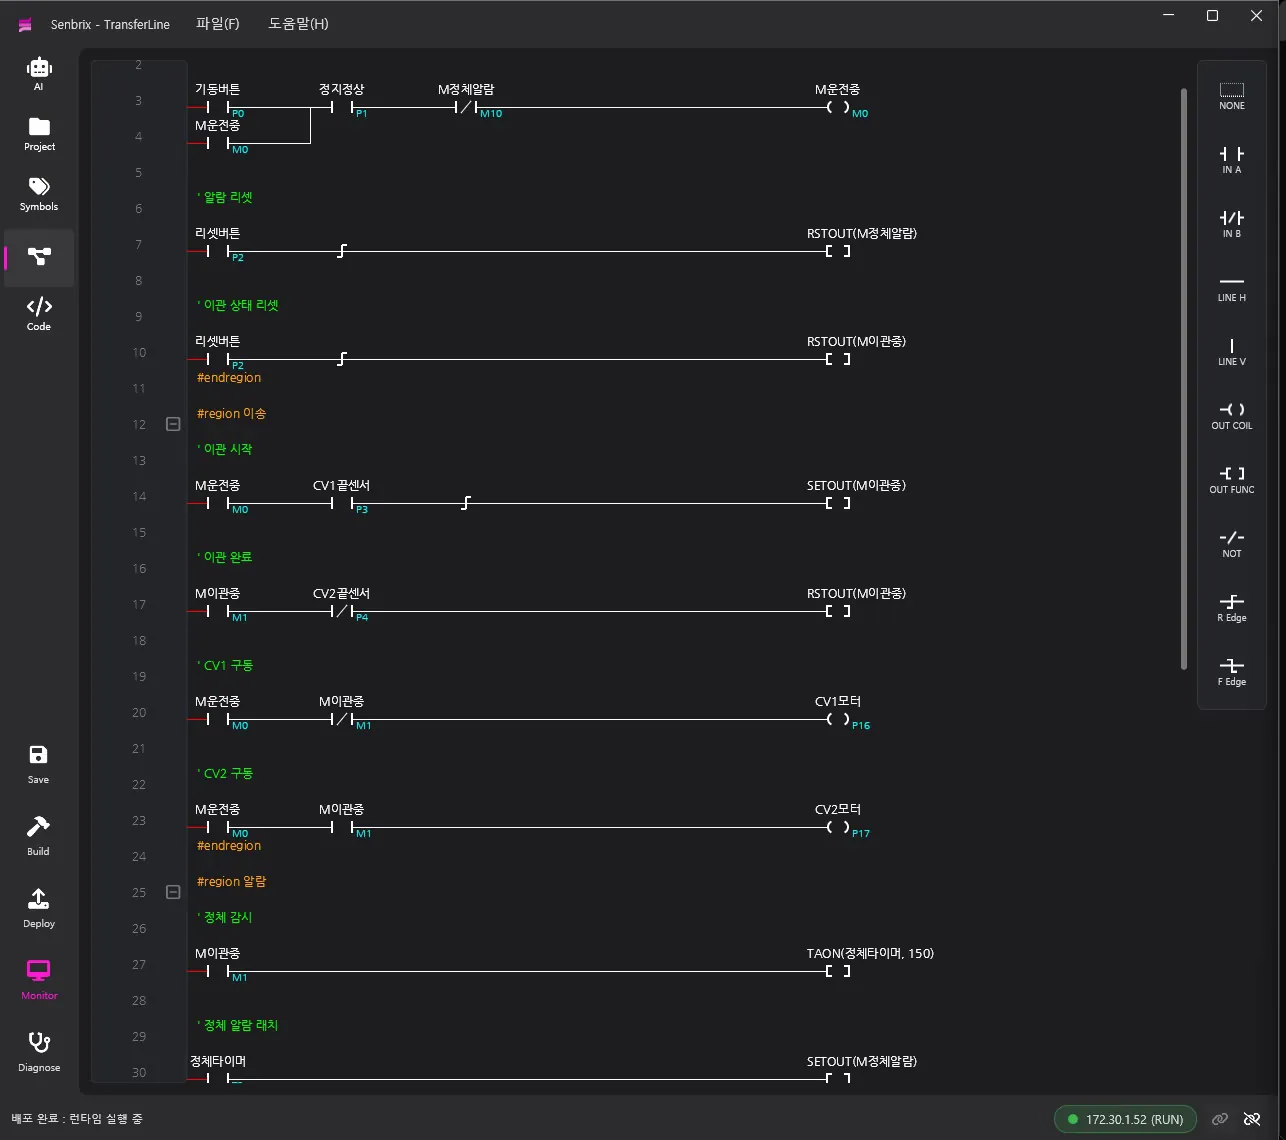
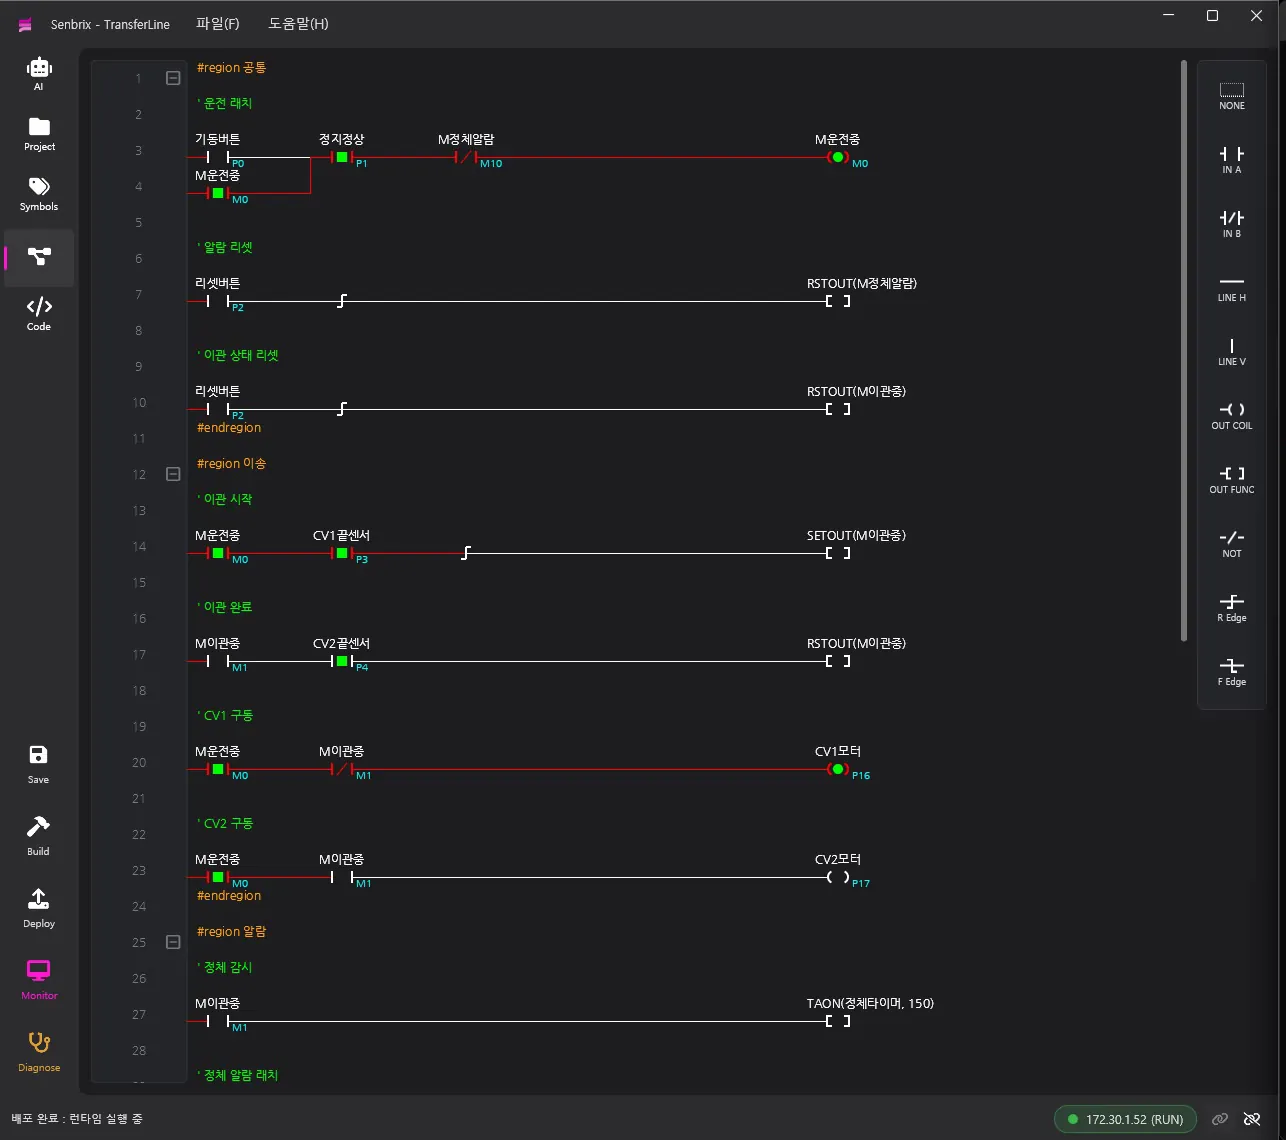
Next came the causal graph query. Trace back from why the CV2 motor won’t run and you land on an internal bit, M이관중 (the “transferring” bit). Working out who sets that bit and who clears it, the AI found a clue in the transfer-complete rung.
The transfer-complete condition the graph showed was /이송/CV2/CV2끝센서(P4), the CV2 end sensor. The leading / is the inversion mark. So instead of reading “product has arrived” as complete, the rung was reading “sensor empty” as complete. The 이송/CV2 attached to that condition is the symbol path I wrote about in Part 3, and this is what I meant when I said the symbols become the AI’s evidence.
With that evidence collected, the cause explanation came out. I’m reproducing it as is. In the block below, M운전중 is the running bit, CV1끝센서 and CV2끝센서 are the conveyor end sensors, and CV1모터 and CV2모터 are the motor outputs.
AI → User
What happens in a single scan (rungs top → bottom, the lower one wins):

@13 transfer start   M운전중 · CV1끝센서↑        → SETOUT(M이관중)   M1 = ON
@16 transfer done    M이관중 · /CV2끝센서(=OFF)  → RSTOUT(M이관중)   M1 = OFF   ← cleared in the same scan
@19 CV1 drive        M운전중 · /M이관중          → CV1모터 ON        ← so only CV1 runs
@22 CV2 drive        M운전중 · M이관중(=OFF)     → CV2모터 OFF       ← symptom 1
@26 jam watchdog     M이관중(=OFF)               → TAON never accumulates ← symptom 2 (T0=0 → alarm never fires)
Both symptoms (CV2 stopped + no alarm) come from one cause — they are not separate faults.
In the very scan that starts the transfer, the rung below wipes the transfer state. By the time the scan ends, what’s left is always OFF.
I’m saying this about a fault I picked and planted myself, but this class of bug is hard to catch in the first place. Read the values all you like; it looks exactly like a normal stop. And it passes the structural ladder check. The AI wrote the same thing in its report.
AI → User
A snapshot cannot distinguish this from a normal stop, and
lint_ladderdoes not catch it either (it is not a double coil — the baseline was in factclean=true).
That’s why the procedure says to cross-check the source, the graph and the live values against each other. That’s where this fault got caught, too.
The Fix
Cause found, time to fix it. The AI backed up the current ladder, took a structural-check baseline, and changed the B contact on the transfer-complete rung to an A contact. Syntax validation, structural check, build: all passed. Up to this point I let it work alone. Fixing ladder inside the editor is what the Part 5 assistant does all day, and the editor isn’t the equipment.
Arming
Next is deploying the fixed ladder to the runtime. Right in front of that, the AI stopped itself.
AI → User
Verification result — not yet. Stopping here.
Deploy and force reproduction are arming-required tools, and currently armed=False. Which means the only thing fixed so far is the ladder in the editor; nothing has gone to the local runtime. Run it again now and the symptom is unchanged.
Arming is this system’s permission gate. When a human switches on diagnostic mode in the editor, they pick the addresses the AI is allowed to write from the equipment tree. Anything not on the allow list stays off-limits even while armed.
I didn’t build any path for the AI to arm itself. The most it can do is state which addresses it needs and ask. This time the request looked like this.
AI → User
P0 (start button) · P1 (stop normal) · P2 (reset button) · P3 (CV1 end sensor) · P4 (CV2 end sensor)
I deliberately left the outputs (P16·P17·P18) out — reads need no permission, and if I force an output I cannot tell a value the logic produced from one I set myself (echo illusion).
Requesting only the addresses needed to confirm the hypothesis, and not mistaking a forced value for one the logic produced: both are principles written in the procedure doc. They show up word for word in the request. I entered the five addresses in the editor and armed it. Then I typed one line in the console. Armed, go ahead.
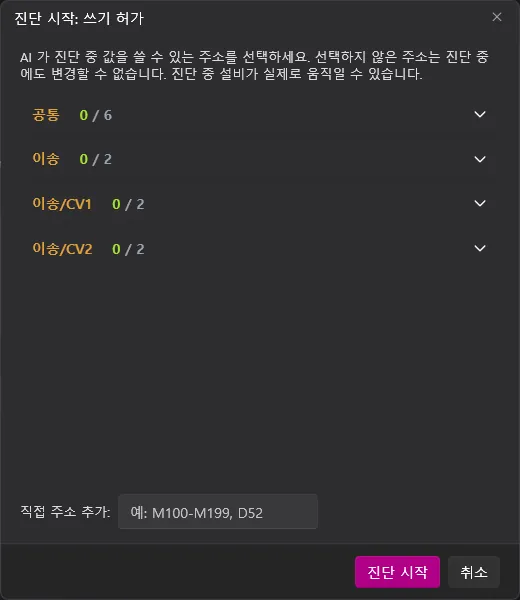
Back in the Part 2 system layout, the one line I left undrawn was the one between the AI and the runtime. I wrote that it had security issues and would be a spot to come back to. This is how that spot got filled. The AI touches the addresses a human opened by arming, and only for as long as they stay open.
In Part 5 I wrote that deployment is where a human presses the Deploy button. In diagnosis, arming is that spot. The button became arming, that’s all. There is still no path onto the equipment without permission.
Reproduction Test
With arming confirmed, the AI ran the deploy. Save, build, transfer, runtime restart, all in one go. Now to check whether the fix actually fixed anything.
There’s a rule here too. Before forcing anything, write the prediction. Without a prediction there’s no judgment when the result comes in; that’s the difference between a designed experiment and poking at things, and I wrote exactly that in the procedure doc. Here’s the actual moment.
AI → User
Self-hold OK — button released and
M0=ONholds.Now the decisive experiment. Raising
CV1끝센서(P3)from 0→1.Prediction
- If the fix works:
M1=ON(latch survives),P17(CV2모터)=ON,P16(CV1모터)=OFF- If the fix is void (overwrite still there):
M1=OFF,P17=OFF,P16=ON— the original symptom, unchanged
The force went in and the values came back.
AI → User
Symptom 1 confirmed gone.
M1=ON(no[FORCED]tag — the logic is holding the latch),P17(CV2모터)=ON,P16(CV1)=OFF. AndT0=22(2.2 s): the jam timer has started accumulating.
Six experiments like this, and all six came out as predicted. Here’s the table the AI attached to its final report, unchanged.
| # | Experiment | Result |
|---|---|---|
| 1 | P1=1, P0 0→1 | M0=ON (not FORCED) · P16=ON, start OK |
| 2 | P0 →0 | M0=ON holds, self-hold OK |
| 3 | P3 0→1 | M1=ON · P17(CV2)=ON · P16=OFF · T0 starts accumulating, symptom 1 gone |
| 4 | P4 not raised for 15 s | T0=150 · M10=ON · P18(alarm lamp)=ON · M0=OFF · both motors stop, symptom 2 gone |
| 5 | P2 0→1 (reset) | M10·M1 cleared, T0=0, M0 stays OFF, alarm reset alone does not auto-restart (correct) |
| 6 | Restart → P3↑ → P4↑ | M1=OFF · P17=OFF · P16=ON (CV1 back) · T0=0, positive path of the fixed rung OK |
A few rows worth pointing at.
- “Not FORCED” in row 1: when you query values, forced ones carry a tag. The running bit has no tag, so the logic produced it.
- Rows 2 and 5: nothing to do with what was fixed. They’re regression checks, making sure the fix didn’t disturb self-hold or reset.
- Why row 6 comes last: once you’ve confirmed the fault no longer reproduces, you still have to confirm the fixed rung does its real job and completes a normal transfer.
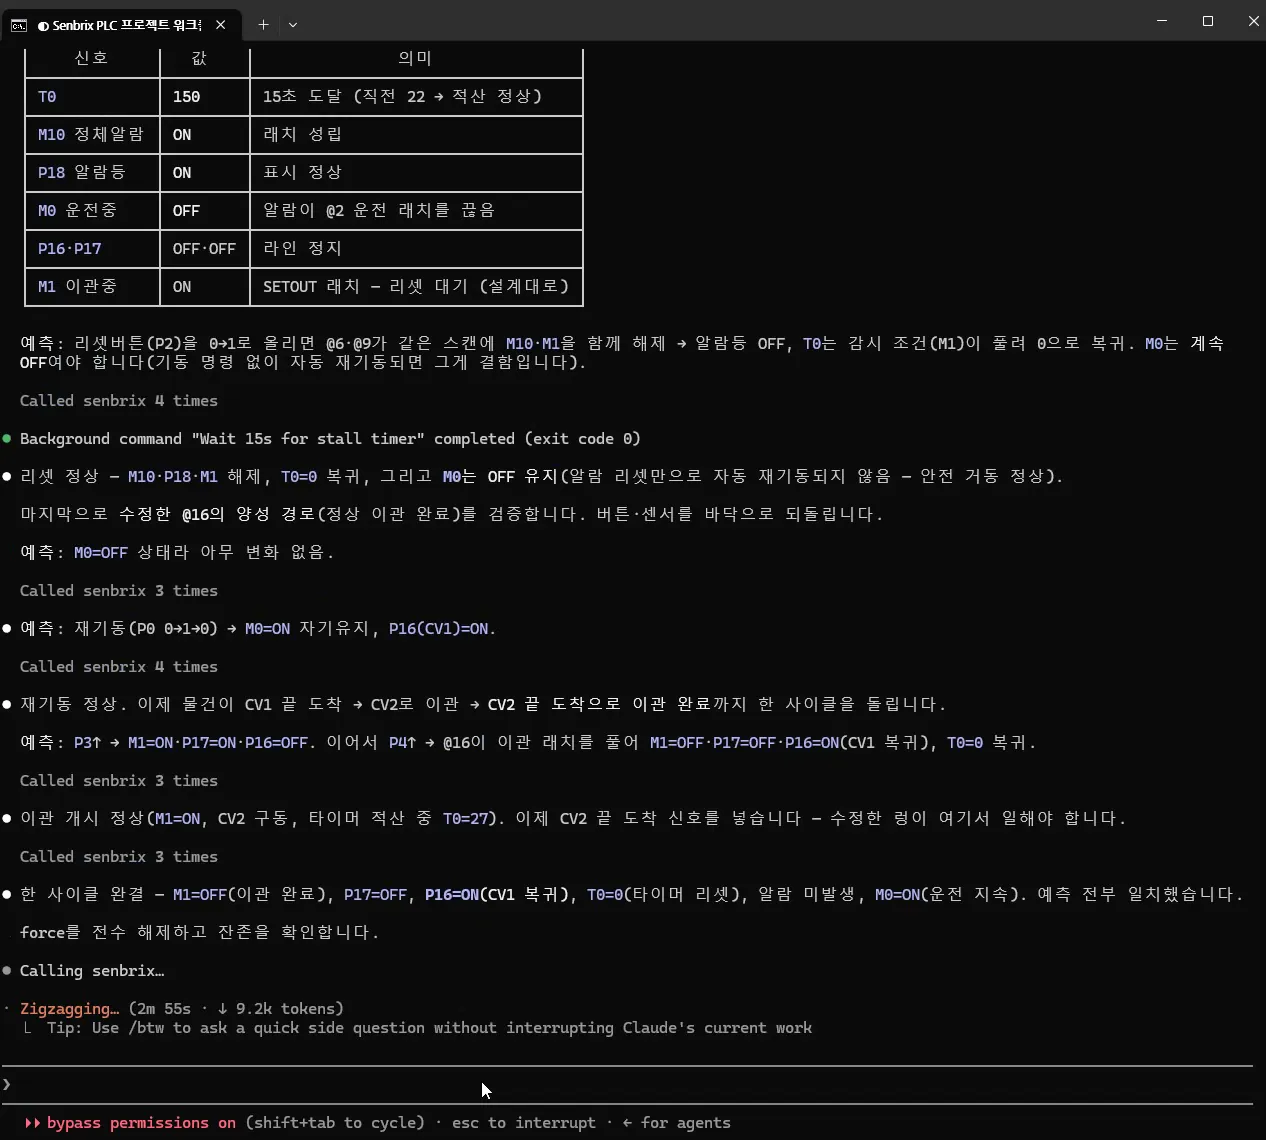
One more thing to note. This desk environment has no board, so releasing a force doesn’t return the value to 0; the last value just stays. Force a 1 onto the same address again from that state and there’s no rising edge, so a button press looks like it never happened.
I stepped on that trap for real in another test a while back and wrote the remedy into the diagnosis doc. This AI came in having read it, split every pulse into a 0 and then a 1 from the start, and never stepped on it once across all six experiments.
When verification ends, every force gets released and a query confirms zero remaining. Forgetting a force you left behind is a classic cause of field accidents, so I made this part of the completion criteria, and this session ended on that check.
Report and History
The report format is fixed too. Five fields: cause, evidence chain, what was changed, verification results, and then residual risks and unverified items. The first four are what you saw above. The fifth is why I made this format at all. It’s the field where you don’t report something as verified when you didn’t verify it. A few items from this report’s fifth field.
- It found that CV1 stops during a transfer, and left it alone. “This may be intended design, so I did not touch it. Changing it is a separate change.” The repair it was asked for was one thing, and it kept to the rule of one change per deploy.
- It only confirmed that the 15-second jam threshold behaves as the timer says. Whether that value suits the site needs real equipment data, it wrote.
- It wrote that whether the stop button is actually wired NC cannot be confirmed with the tools. Beyond memory, that’s for human eyes.
And one thing came along that nobody asked for. During the diagnosis it found that the graph tool doesn’t index the rungs that set and clear a latch, worked around it with a different query, and then listed it in the report as an improvement candidate.
At the end of the report were two things for the human to do.
AI → User
Diagnostic mode is still armed (armed=True) — to finish, please disarm it in the Senbrix UI. Shall I leave this diagnosis in docs/ as a four-field history entry (symptom, context, cause, action)?
I typed one line asking it to log the history. The AI wrote this one diagnosis up in four fields, symptom, context, cause and action, and left it in the project’s docs folder. Logging fault history in four fields is another thing from the field know-how doc. When the next problem hits the same equipment, the next diagnosis reads this entry. Disarming I did myself in the editor, as instructed.
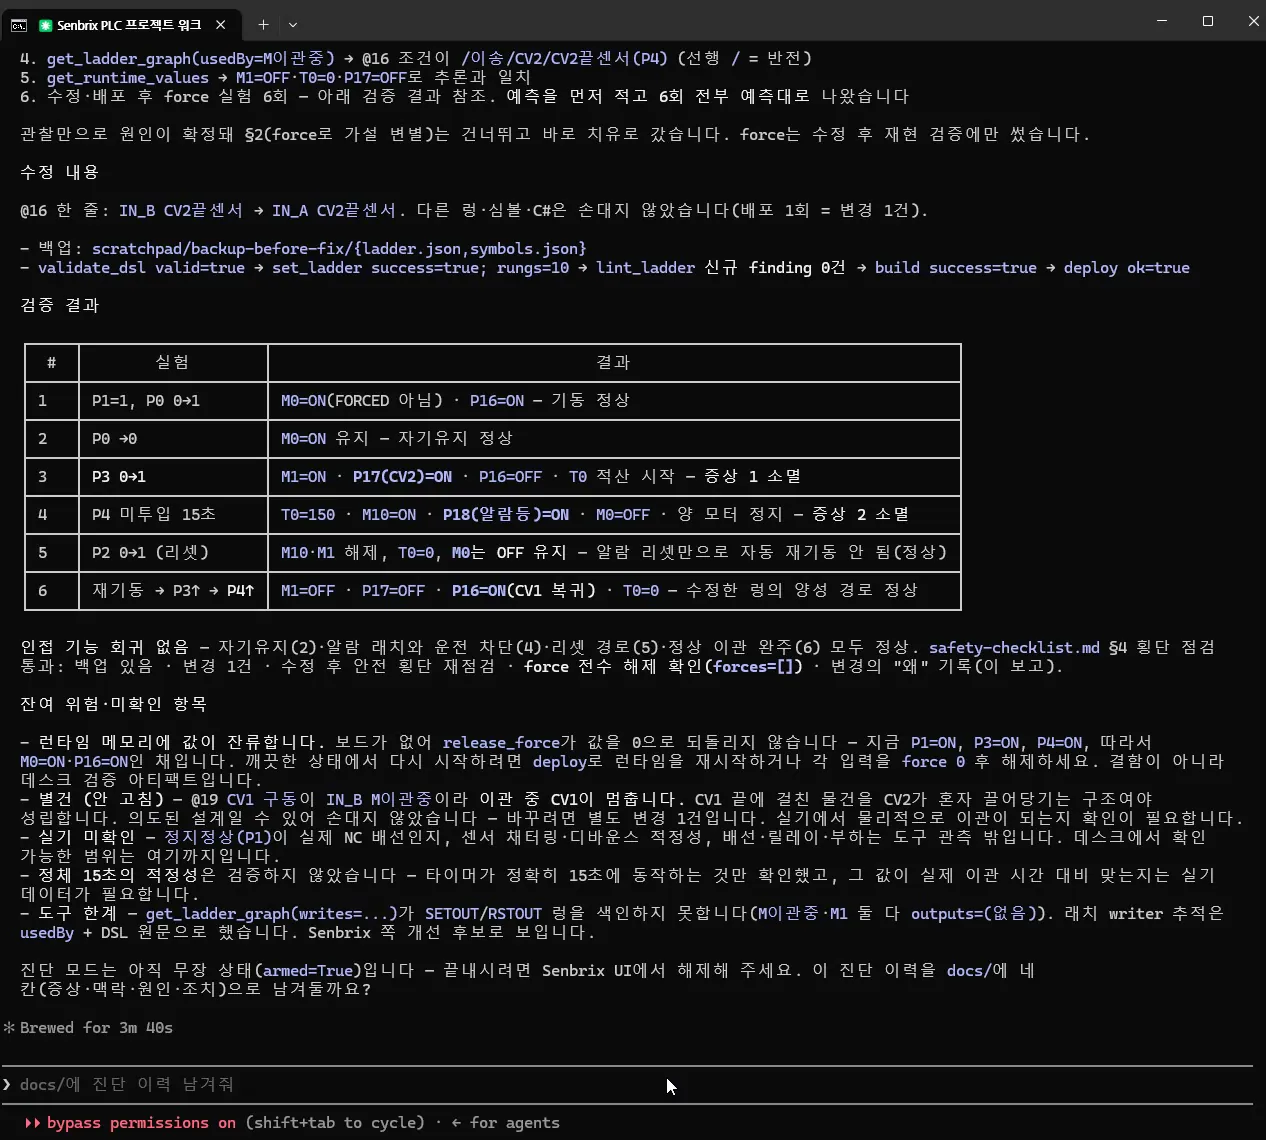
Afterwards I counted. What the human did in this diagnosis was one line of symptoms, one arming, one line saying go ahead, and one line saying log it. About fifteen minutes after stating the symptom, back came a cause explanation, a fixed ladder, a verification table and a history doc.
Wrapping Up
In Part 4 the ladder ran on the equipment. In Part 5 the AI wrote the ladder. In this part the AI caught a fault on the running equipment. That closes the loop.
Counting what got built this time: a tool boundary that separates reads from writes, an order and a cross-check method for observation, arming as the permission gate, predict-first as the experiment rule, a five-field report and a four-field history. I moved the diagnostic discipline that field people know in their bones into documents and tools, and the AI that read them caught the fault by that discipline.
And the whole time, the boundary stayed where it was. Reads are always open. Writes open only inside arming. Tell it the problem and it fixes it, driving the controls itself. Just, all of it inside the range a human allowed.
Next Part
The next part is the last one. What it was like to build a PLC from scratch, what worked and what didn’t.
Comments
Enter a nickname to leave a comment, or sign in with Google or GitHub.