
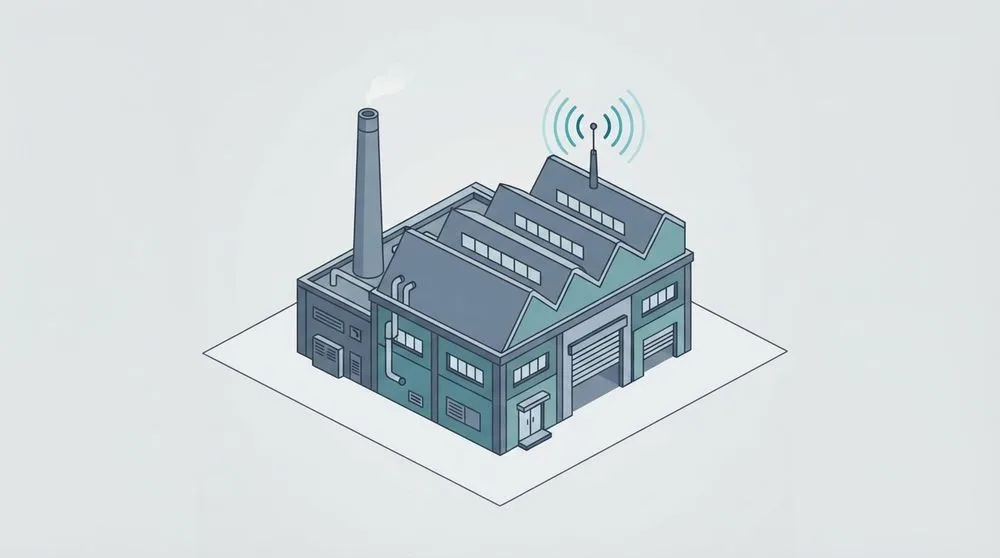
We built a system that collects industrial sensors over LoRa and pushes the readings to a monitoring server. The sensors are MODBUS-RTU slaves, an RP2040-based LoRa device sits in the middle, and a LoRaWAN gateway sits above that. Nothing unusual so far.
The trouble was in the last hop. We sent every five minutes and the server only accumulated one entry every ten. And every send came back with OK.
Finding the cause took a day, and along the way we guessed wrong three times. This post is that process.
The LoRaWAN Class C polling structure — in brief
LoRaWAN Class C polling means that instead of letting devices upload on their own, this system answers when called. Thirty devices transmitting independently collide, and a collision is a straight loss, so we consolidated the calling side into one.
Device:  reads the sensors in rotation every 0.5 s and simply holds the latest values
Gateway: calls one device at a time, one per second, in order
Device:  answers over the air when its turn comes
Thirty devices means a 30-second round. Since a device has to be listening at all times to be called, we use Class C. Why we settled on this, and why we do not wait for the reply, is covered in detail in part three of this series.
Pushing the polling agent inside the gateway
The polling agent that now runs inside the gateway started out on a PC. The PC hosted an MQTT broker, the gateway connected to it, and the PC threw downlinks at it.
There is no PC on site. So we moved all of it inside the gateway.
The gateway is OpenWrt-based with only 6 MB of overlay space to spare. There was no room to install a Python MQTT library, so we implemented the protocol directly. Since all we needed was CONNECT / SUBSCRIBE / PUBLISH / PINGREQ, that was simpler anyway.
var = b"\x00\x04MQTT\x04\x02\x00\x3c"      # 3.1.1, clean session, keepalive 60
body = var + struct.pack(">H", len(cid)) + cid
sock.sendall(bytes([CONNECT << 4]) + _rem_len(len(body)) + body)
Then we changed the gateway’s MQTT integration address from the PC to 127.0.0.1. That one line cut the PC dependency.
uci set lorasrv.lorasrv.broker_ip='127.0.0.1'Now the site runs with the PC switched off. The PC was demoted to a monitor window watching from the side.
The server said OK and half the data disappeared
The missing server records are where the real story starts.
The agent sends data from two devices to the server every five minutes. The log recorded this every single time.
12:50:00  packet to send: {...}
12:50:00  remote send OK — response "OK"
12:55:00  packet to send: {...}
12:55:00  remote send OK — response "OK"
But the server screen had 12
and no 12. The packets were identical, yet one went in and one did not.Wrong answer one — “it drops anything with a module number”
We built a rule out of a few lines of the server list. Only the rounds that included a module number were missing. So we concluded that the server rejects module numbers.
Wrong. It was not dropping them — it was filing them under a different device.
The server identifies a device by concatenating Type and Id.
"Type":T01"Id":00001,00002        →  T01-00001-00002
"Type":T01"Id":002,00001,00002    →  T01-002-00001-00002    ← a different device
Adding and removing the module number was swapping the device out. If you are looking at the old key, it appears to have stopped at that timestamp.
Wrong answer two — “sending two devices in the same second keeps only one”
Sending both devices back to back within one second looked like it kept only one. “Simultaneous arrival is the problem,” we thought, and inserted a 10-second gap between devices.
Wrong. Data we received later showed both records registered side by side on consecutive row numbers. We took the gap back out.
Wrong answer three — “there is no ten-minute rule”
Once, we got it right. We said “it looks like only one save every ten minutes.” Then the next list we received contained an entry stored at a five-minute interval, so we withdrew our own conclusion.
Those counter-examples were the rounds whose contents differed. The rule was correct and we abandoned it.
The fourth try — looking at the whole thing
The problem, every time, was building a rule out of partial data.
The server list carried dozens of records a minute from sources other than ours. Ours was one line every five minutes, and in that flood it was far too easy to miss a line and read it as “never arrived.”
We requested the complete list filtered to our records only and matched it line by line against our own log. All 13 records fit a single rule, with no exceptions.
| Sent at | Gap from previous save | Content | Server |
|---|---|---|---|
| 12:45 | 7.7 min | same | ✗ |
| 12:50 | 12.6 min | same | ✓ |
| 12:55 | 5.0 min | same | ✗ |
| 13:00 | 10.0 min | same | ✓ |
| 13:15 | 7.0 min | same | ✗ |
| 13:15 | 7.6 min | changed | ✓ |
| 13:20 | 4.4 min | same | ✗ |
The rule: identical content from the same device is stored only once every ten minutes. If the content changes, it is stored immediately.
13:15
is the decisive one. Only 7.6 minutes had passed and it went in — and that was the round where we changed the value formatting from decimal to integer. That was proof that content, not just elapsed time, enters the decision.Why we hit it was mundane. We were in testing, so the sensor value had not moved a single digit for hours. Equipment that transmits every 20 seconds gets stored every time, because a real sensor’s value keeps drifting slightly.
The response — if the value has not moved, nudge it
If a value is not different from the previous one by even one character, we alternate +1 / −1 on the least significant digit so that every round differs.
13:45:00  V:00032   ← value unchanged, nudged +1
13:50:00  V:00031   ← differs from the previous (32), so left alone
13:55:00  V:00030   ← value unchanged, nudged −1
Alternating the direction keeps the value from drifting one way. And because the reported value now differs from the sensor by 1, every nudged round is written to the log. We need to be able to trace it later, when a server value does not match a physical measurement.
That said, this is a workaround. A value that never changes is itself information for a monitoring system, and if a sensor shorts and freezes at one value, the server will not notice. So we formally asked the receiving side to record identical values on every cycle as well. If they accept, the nudging is switched off with one configuration line.
Restart, log, and alarm problems caught along the way
Restarts, lost log files, and the alarm rate floor were side findings we picked up while chasing the cause, and they turned out to be more useful than the cause itself.
A restart eats a whole round
The send loop looked like this.
while True:
    time.sleep(self.interval)     # sleeps the full 300 s first
    send()
A restart starts the 300 seconds over from the beginning. Restart within five minutes to tweak a setting and that round never goes out at all. We spent a whole morning restarting while getting the format right, and on the server that looked like missed transmissions.
We fixed it in two directions. One is wall-clock alignment — send at :00 :05 :10 and the next slot arrives on time regardless of restarts. The other is persisting the last send time to a file so it survives a restart.
since = time.time() - self._read_last_send()
if since >= self.interval:
    send_now()
else:
    log("last send %d s ago — skipping the startup send and waiting for the next slot" % since)
Without this you get the opposite problem: send on the hour, restart a minute later, and the same value slips in again between slots and overwrites the list.
Log files disappear
Wanting records that survive a reboot, we put the log in /var/log. It kept vanishing.
/var being tmpfs was part of it, but the real cause was elsewhere. Every 30 minutes the gateway rewrites its own system log into that folder and takes our file with it.
We moved to the SD card. It is registered in fstab by UUID so it mounts automatically after a reboot, and it had 29 GB free.
dir = /mnt/mmcblk0p1/agent
require_mount = /mnt/mmcblk0p1     # falls back to /var/log if the card is missing
require_mount is the key part. Calling makedirs with no card present creates a directory of the same name on root and fills the 6 MB overlay with logs. At that point the gateway itself starts misbehaving.
The alarm rate limit swallows the recovery notice
When a state changes we send immediately instead of waiting for the cycle. But a flapping sensor connecting over and over would get us blocked by the receiving server, so we put a per-device rate limit in place.
The problem was that changes blocked by the limit were being discarded.
14:26:33  alarm 0→3  sent immediately ✅        server: alarm
14:26:43  clear 3→0  only 9 s later, held ❌     server: still in alarm
14:30:00  corrected only by the scheduled send
For 3 minutes and 17 seconds, an alarm that had already cleared was still on the screen. That is worse than arriving late.
Our first thought was “exempt recoveries from the limit,” but the arithmetic says no. A sensor flapping once a second produces states of 3,0,3,0…, so exempting recoveries alone yields 30 sends a minute. Worse than the current 6.
The answer was to defer instead of discard. Hold the suppressed state and release it the moment the limit expires.
14:26:43  clear 3→0  →  "deferred by 2 s"
14:26:45              →  "deferred state 0, sending now"
The connection count is unchanged, because the send condition is the rate limit itself. While the sensor flaps, the deferred value is continuously overwritten by the newest one, so what goes out is not a queue of backlogged changes but the state at the moment the limit expired.
The send thread could die quietly
The send loop ran on a daemon thread with no exception handling. If a single exception escapes, only that thread dies while the polling keeps running. The process is alive, there is not one error line in the log, and transmission simply stops forever.
It looks exactly like “sending is broken,” which makes it extremely hard to diagnose if it happens on site. We wrapped the loop body in try/except and made it emit log.exception. Losing one round is fine as long as the next cycle still comes around.
What is left — why partial data cannot build a rule
Class C polling and a Python agent running inside a gateway are neither of them technically new. Both are common structures.
What stays with us is the shape of the three wrong guesses. All three were the same mistake — build a rule from a few lines of partial data, then refute it with another slice of partial data. Each time a plausible explanation appeared, and being plausible made us hold on to it longer.
Once we laid the whole thing out and matched it line by line, all 13 records fell into place at once. Doing that comparison from the start would have made it 30 minutes instead of a day.
Build a rule only from a full 1
comparison of both sides. A rule built from a fragment gets refuted by the next fragment.
And one more thing. Logging the exact content we sent is what eventually gave us the answer, because we never had to guess what had gone out. The nudged rounds are logged for the same reason — we have to be able to trace them when the numbers stop matching a physical measurement.
A rule can only be built from a full 1
comparison of both sides; a rule built from a fragment gets refuted by the next fragment.🔧 The whole series: part 1, silence and the sync word · part 2, the sensor simulator · part 3, the poller that does not wait · part 4, designing the enclosure · part 5 (this post)
Contact
- Email: [email protected]
- Instagram: https://www.instagram.com/going.sen/
- Website: https://intosen.com/kr/consult/
Comments
Enter a nickname to leave a comment, or sign in with Google or GitHub.