
We uploaded one zero-energy building schematic and said the screen was 800×480. DV-HMI took it from there with questions, and 1 hour 57 minutes later we had a verified touch panel simulator. It runs on calculations inside the program with no real equipment, so the numbers on screen are not real building performance.
If DV-HMI is new to you, the water pump sample post explains it. This sample answers a different question: what do you have to decide when you start from a single drawing, with no devices and no address table?
What the schematic gave us
The drawing shows a PVT collector, two storage tanks, a heat pump, a ground heat exchanger, a fan coil, a building, five pumps and some three-way valves, plus five labelled operations. We read the piping from an enlarged copy and wrote the connections out in words for a human to check. The shakiest guess was pump P3: we read it as running alongside P2 only when tank 1 is the heat source. That turned out to be right.
The drawing has no numbers for when each operation runs. DV-HMI proposed starting values and a person approved them.
| Operation | Path | Auto turns it on when |
|---|---|---|
| PVT charging | PVT → tanks 1 and 2 | Sun right now is 200 W/m² or more |
| Heat pump charging | Heat pump → tank 2 | Tank 2 is below 50 ℃ and cooling is off (stops at 60 ℃) |
| Heating | Tank 2 → fan coil → building | Outdoor below 15 ℃, with a building load |
| Cooling | Heat pump → fan coil → building | Outdoor 26 ℃ or above, with a building load |
| Hot water | Tank 2 → building | Tank 2 is 45 ℃ or above |
Questions filled in what the drawing left out
A picture can’t tell you how a program should behave. So the questions came one at a time, and each chosen sentence went into the requirements word for word.
| Question | Decision |
|---|---|
| What does it connect to? | Nothing. Simulation only |
| What can you operate? | Manual: switch operations yourself. Auto: the program chooses from the conditions |
| Operations that can’t run together? | Turning one on turns the other off (heating and cooling, heat pump charging and cooling) |
| How are temperature and energy calculated? | A simple heat balance with starting equipment values |
| Which screens? | Main, Simulation, Trend, Setup. No alarm screen |
| Save results? | No files. Restarting starts over |
| How do you change conditions? | Three season presets and sliders |
| Does the sun move? | It rises from 06, peaks at 12 and is zero from 18 |
| State at power-on? | Paused. Nothing moves until you press Start |
| Where does the electricity go? | Own use, then battery, then grid |
That power-on answer came back to bite us once the program reached the panel.
Four screens
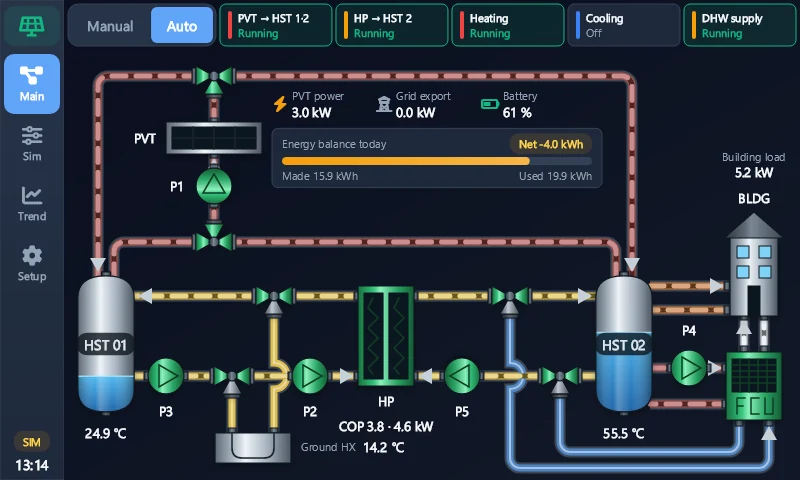
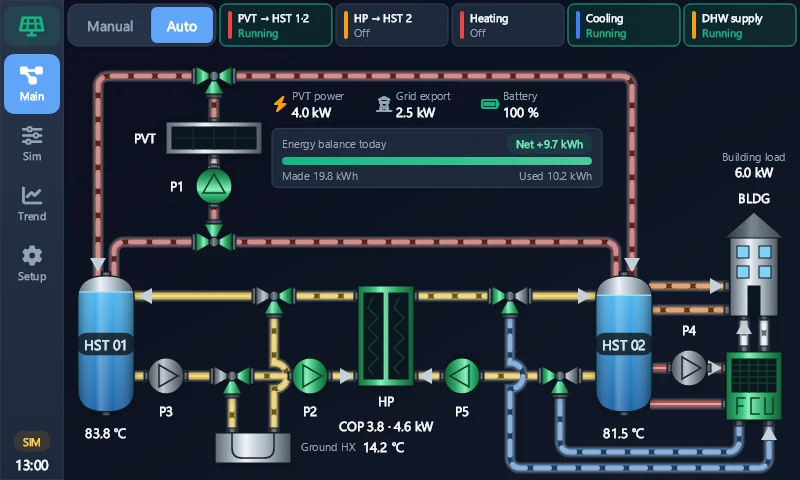
Main is the process diagram. Moving dashes mark the pipes with flow, and running pumps and open valve branches turn green. You switch between manual and auto at the top, and in manual you press an operation box to turn it on or off. Below is the summer case: unlike the winter picture, cooling water loops under tank 2 to the fan coil.
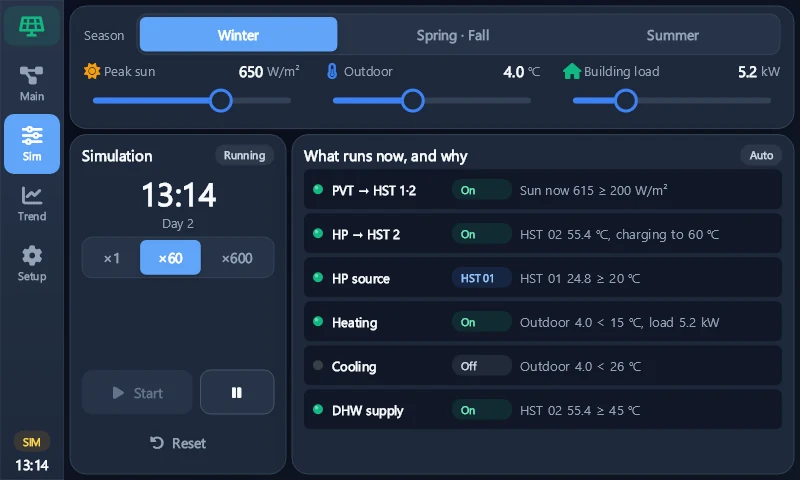
Simulation is where you change conditions and use Start, Pause, Reset and the speed buttons (×1, ×60, ×600). The right side lists each operation and why it is on or off, with the values. It lets you follow the auto rules by eye.
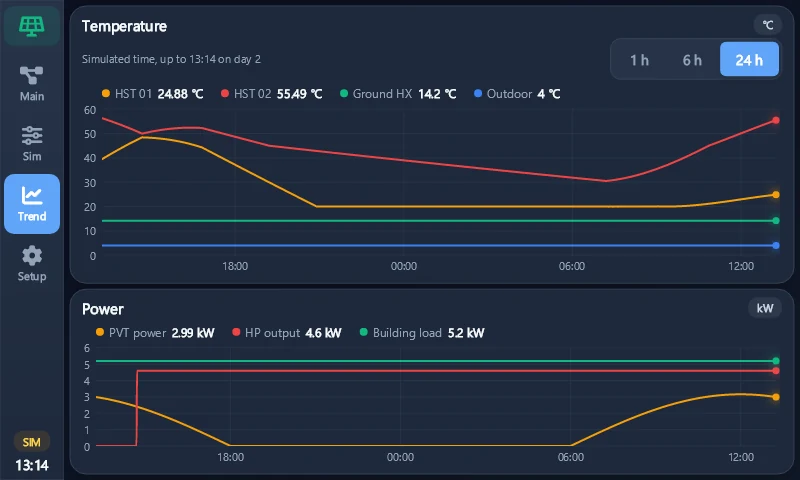
Trend plots temperature and power against simulated time, and you can see day and night in it. PVT power hits zero at sunset, and tank 2 falls overnight before climbing again in the morning.
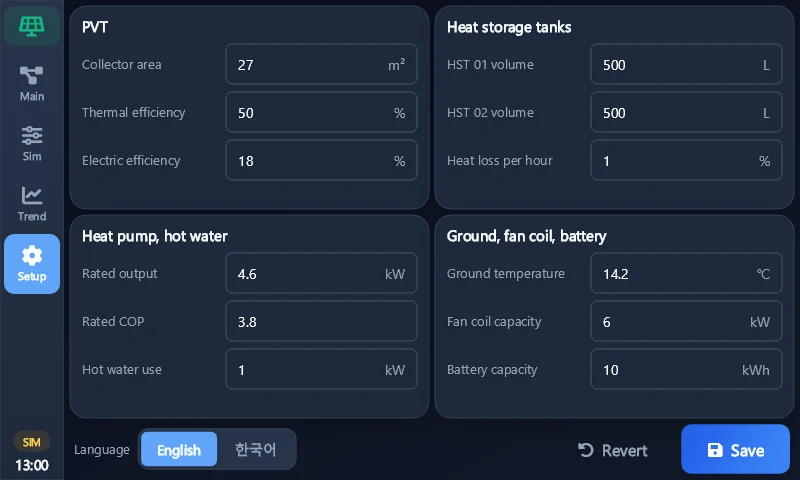
Setup holds the 12 equipment values the heat balance uses. Saving applies them from the next calculation without stopping the simulation.
“The pipes are all wiggly”
Near the end of the build, the request came in after a look at the main screen: the pipes wiggle all over the place, please tidy them up.
There were two causes. Pipes crossed each other 8 times, and every crossing draws a little hop. Equipment heights also didn’t line up, which meant lots of bends. At 800×480 the library’s standard pumps and valves were big enough to leave no room for straight rows.
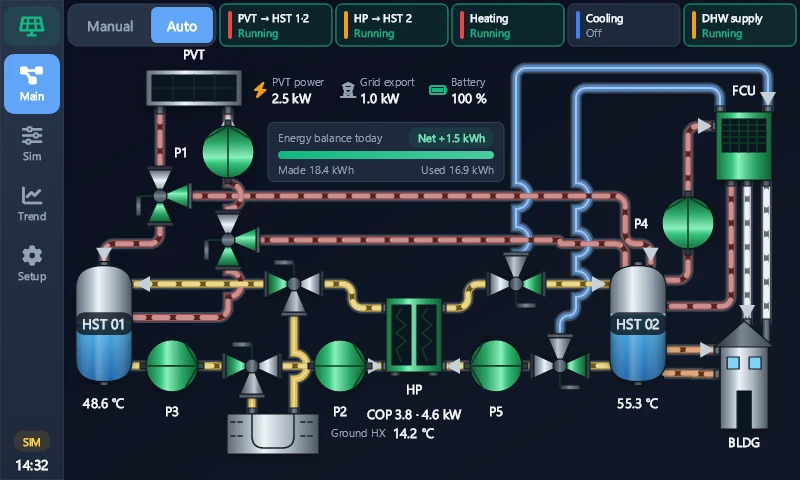
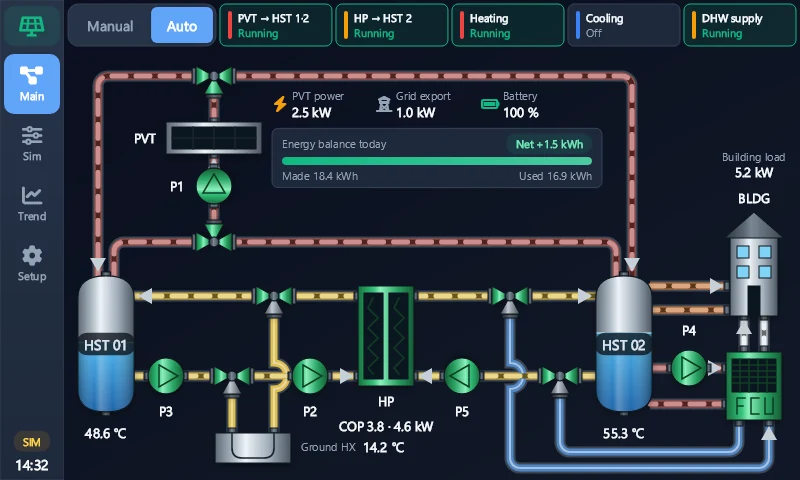
| Item | Before | After |
|---|---|---|
| Pipe crossings | 8 | 2 |
| Pump and three-way valve size | 64×64, 60×64 (standard) | 44×44 (custom) |
| Pipes at the heat pump | Bent up and down to connect | Straight, at the same height |
| Cooling pipes | Hop over the red pipes | Loop under tank 2 |
We made the heat pump symbol as tall as the gap between the two pipe rows, moved the PVT between the two red pipes, and swapped the building to the top and the fan coil to the bottom. The trade-off is that the layout no longer matches the original schematic, and that decision went into the requirements and was approved. The cleanup took about 10 minutes.
The PVT, heat pump, fan coil, ground heat exchanger and building started as stand-in symbols in the interview drafts. They got custom symbols during the build.
Seven days on the starting values
This is a calculation-only run for seven days, in auto, on the starting values. The figures are from day 7, once things settled.
| Conditions | Tank 1 | Tank 2 | Made per day | Used per day | Balance |
|---|---|---|---|---|---|
| Winter | 19.9–33.0 ℃ | 30.0–60.0 ℃ | 24.1 kWh | 33.9 kWh | -9.8 kWh |
| Spring and fall | 85.1–95.0 ℃ | 62.3–95.0 ℃ | 26.0 kWh | 0.5 kWh | +25.5 kWh |
| Summer | 85.3–95.0 ℃ | 63.1–95.0 ℃ | 31.6 kWh | 34.4 kWh | -2.8 kWh |
The table exposes gaps in the rules:
- In spring, fall and summer, tank 2 hits the 95 ℃ calculation limit on day 1. The approved PVT charging rule has no temperature ceiling, and collector temperature isn’t calculated
- In winter, tank 2 falls to about 30 ℃ at night. At 30 ℃ or below, heating has nothing to give, and that happens for about 0.1 hours a day
- In summer, cooling stops at 4.6 kW against a 6 kW building load. The heat pump’s starting rating is 4.6 kW
Every condition and equipment value here is a starting value and the model is simple, so these numbers say nothing about real building performance. Daily use also leaves out general loads like lighting and outlets. What we got from this table is a list of gaps in the rules, and we haven’t changed the rules or values yet.
We deployed it and nothing moved
We turned on simulation in the deploy dialog and sent it to a Senvas touch panel. The deploy log shows 4 seconds from publish to running. Then came the question: why isn’t the simulated PLC working?
The deploy log was clean. We reproduced it without opening a window by pressing the real screen buttons from code. Before pressing Start, the clock still read 06
after 5 seconds. At 06 the sun is at zero too, so PVT power reads zero and there are no dashes. After Start, at ×60, it reached 06 in 5 seconds.So nothing was broken. It had started paused, exactly as approved. But Start lives only on the Simulation screen, and the main screen doesn’t say it’s paused, so it’s easy to see why it looked broken. Pressing Start on the panel got it moving too.
“Simulated PLC” was worth clearing up as well. This program has no PLC and no communication, because we chose simulation only, so everything is calculated inside the program. We also offered a Start button on the left menu, and this time the answer was no.
What verification fixed
After the full test run, a separate reviewer who hadn’t written the code went through it. It found 5 problems, and 4 got fixed.
- A failed settings or language save showed nothing. It now shows a dialog
- If the user data folder didn’t exist yet on the panel, settings could land elsewhere or the program might not start. The path is now always the same
- The reason column could read
200 < 200. Those values now round down - A settings file with missing values got filled in with starting values. It now counts as broken
The fifth wasn’t a code problem. The approved requirements said the flow display “stops” during a pause, but the library can’t hold moving dashes still. We changed the requirement to say the dashes disappear, and it was approved again.
How long it took
These times come from commit timestamps.
| Stage | Time | Waiting on people |
|---|---|---|
| Interview (screen drafts, requirements) | 57 min 41 s | Included |
| Plan (work list, plan report) | 7 min 16 s | Included |
| 8 build tasks | 21 min 43 s | None |
| Piping cleanup request | About 10 min | None |
| Verification (full tests, review, fixes) | 17 min 48 s | None |
| Setup to verified sign-off | 1 h 57 min | Included |
| Size | Value |
|---|---|
| Program | 1,274 lines of C#, 439 lines of screen markup |
| Test code | 692 lines, 56 automated tests |
| Work history | 14 entries (8 planned, 1 request, 5 fixes) |
What we haven’t done
- It isn’t connected to real equipment. That would be separate work, starting with choosing devices and an address table
- The equipment values and rule numbers are starting values, not fitted to a real building
- We haven’t separately measured how touch feels on the panel or how the screen keeps up at ×600
Takeaways
- Even with no devices and one drawing, narrowing things down with questions gets you a working HMI simulator
- One comment on the screen took pipe crossings from 8 to 2, and one question on the panel showed how confusing a paused start can be
- The seven-day run surfaced gaps in the rules first. It doesn’t tell you how a real building performs
Installation and the full feature list are in DV-HMI Features and a Water Pump Sample.
Contact
- Email: [email protected]
- Instagram: https://www.instagram.com/going.sen/
- Website: https://intosen.com/kr/consult/
Comments
Enter a nickname to leave a comment, or sign in with Google or GitHub.