
DV-HMI (dv-hmi) is a plugin for building equipment HMI programs by talking with Claude. Describe the program and upload an address table or a manual, and you get a C# program with screens, device communication, alarms and records. People still decide what gets built and approve it.
This post covers what the current version (dv-hmi 0.1.27, Devinno.UI 0.4.9) can do and shows a three-pump water supply HMI sample we built with it. The sample is not connected to a real PLC yet. It runs against a simulated PLC inside the program.
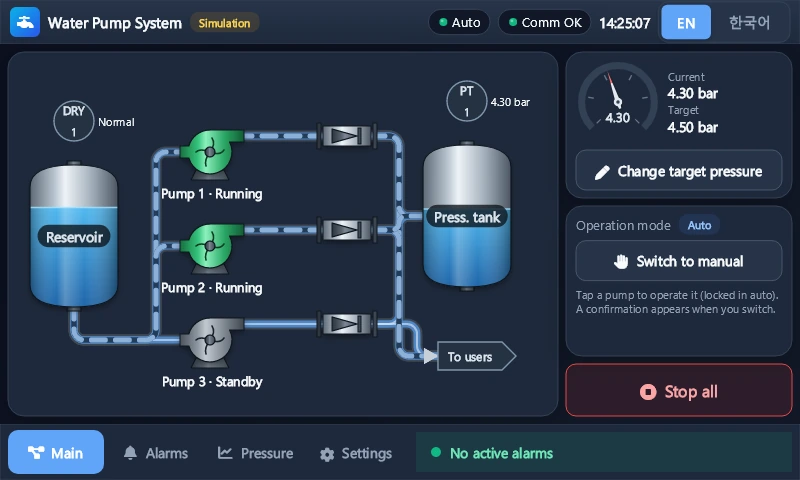
What DV-HMI does
| Feature | What it does |
|---|---|
| Project setup | Answer three questions (name, way of working, target) and the project is ready in 1 to 3 minutes, with the dashboard open |
| Requirements | The conversation is written down as requirements, and what a person approves becomes the basis for the work |
| Screens | Screens are built from buttons, gauges, trends, alarm lists and process diagram (P&ID) controls |
| Screen previews | Screens are drawn with example values and checked for cut-off parts, text overflow and empty areas |
| Device communication | Modbus RTU/TCP, LS XGT, Mitsubishi MC, Siemens S7, Omron FINS, MQTT, SECS/GEM |
| Simulator | A simulated device is built alongside the program, so it can run without equipment |
| Automated tests | Each finished piece of work is built and unit tested, and the results are recorded |
| Deployment | A zip that runs without installation on Windows; on a Senvas touch panel, transfer, install, auto-start and launch |
| Deployment options | Two checkboxes in the deploy dialog set simulation use and GPU use (0.1.27) |
| Screen language | English by default, with Korean selectable |
What you are left with is an ordinary C# solution in the project folder. It holds the program, its unit tests and a device simulator, and it builds and runs without the plugin, so people can maintain it by hand later.
What changed in 0.1.27
Simulation use and GPU use moved to appsettings.json in the program folder. On a PC the developer sets them in this file, and for a panel they are set with two checkboxes in the deploy dialog.
- Simulation: it cannot be changed from the program’s screens. This keeps users from turning a real machine into a simulated one, or the other way round
- GPU: turning it off switches to software graphics before the window is created, so the window also opens on boards without OpenGL ES 3.0, such as a Raspberry Pi 3 or older
Following the work on the dashboard
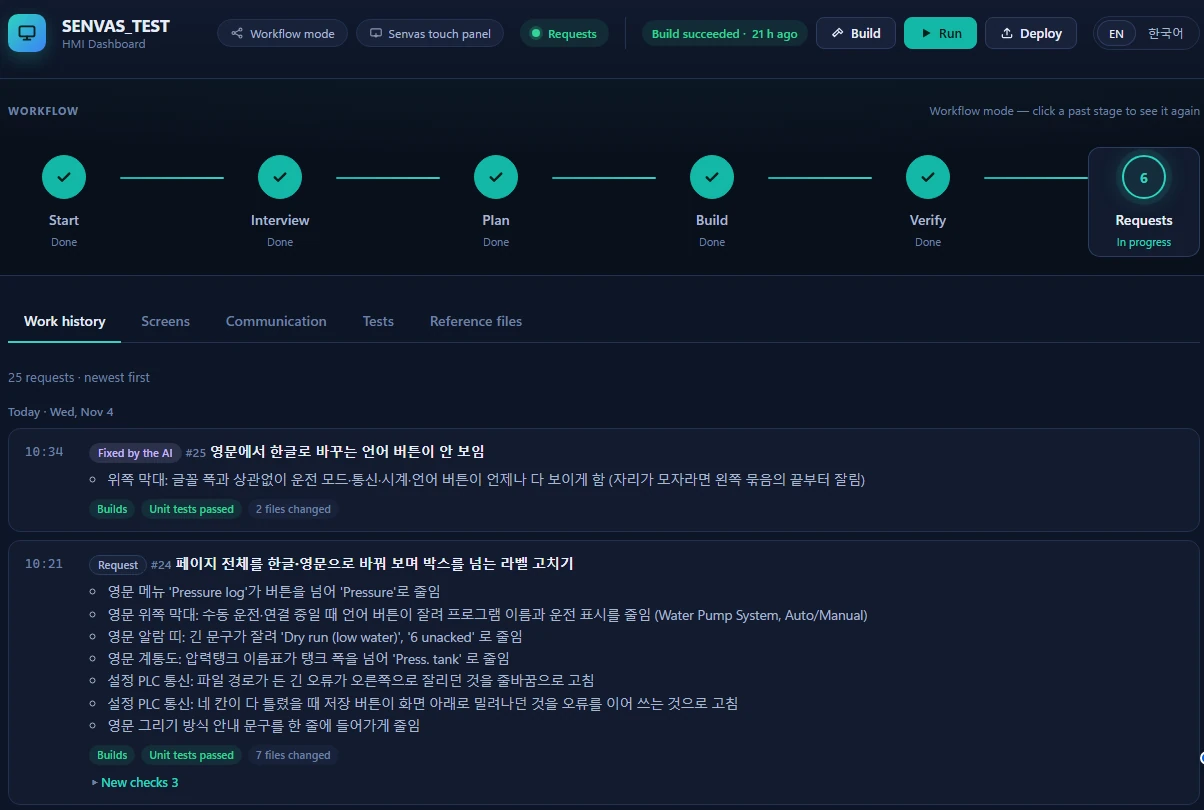
A dashboard opens next to the chat. Workflow mode moves through Interview → Plan → Build → Verify → Requests, and pressing a past stage shows its content again. The work history collects what changed in each request, with the build and test results.
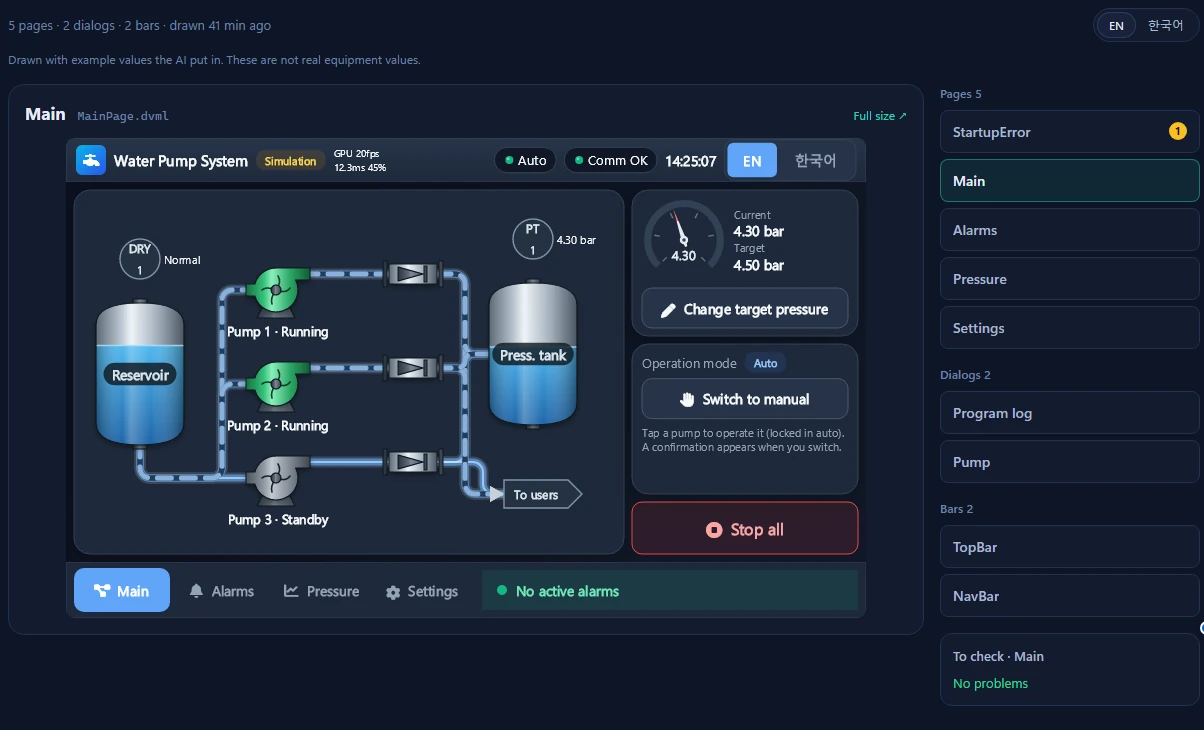
The Screens tab shows pages and dialogs as pictures in each language. You can check how they look without running the program, and problems such as text overflow are listed beside them.
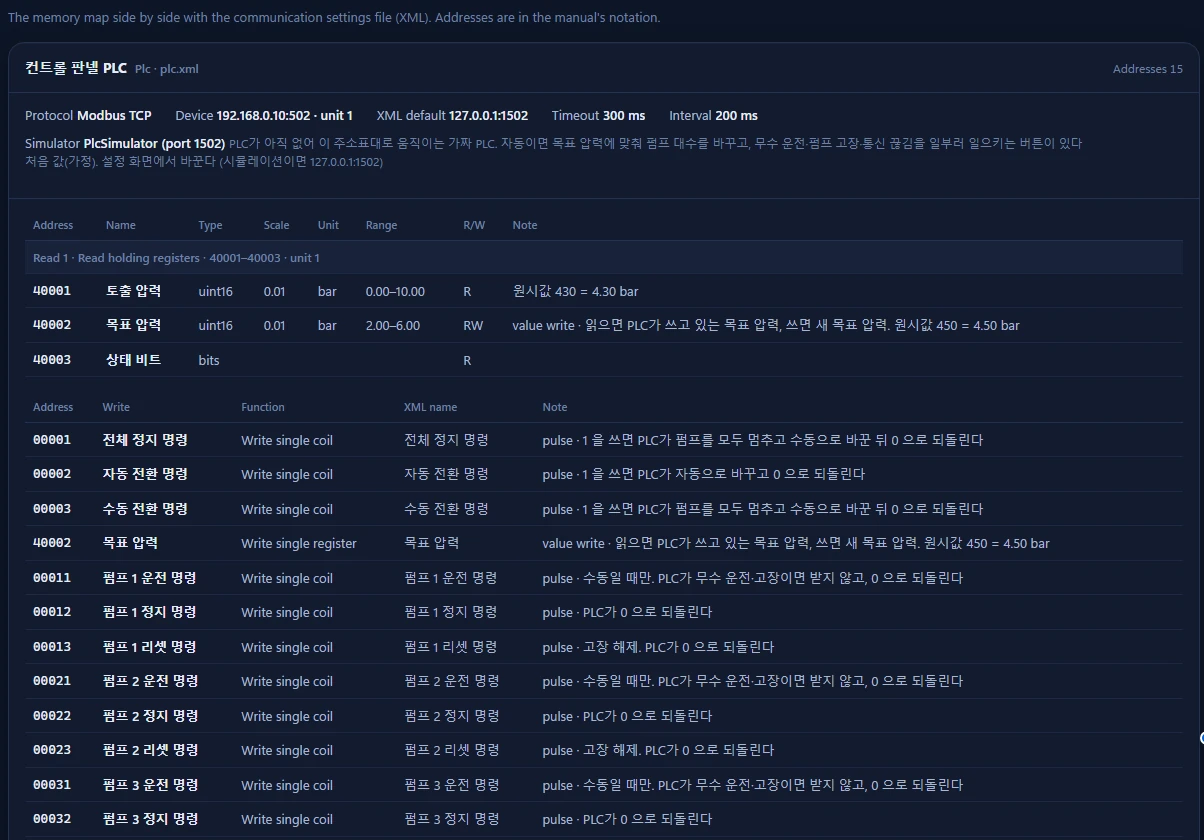
The Communication tab shows the address table next to the communication settings, so units, scales and write methods can be checked without opening the program. This sample’s address names are in Korean, and the device address in the picture is an initial test value.
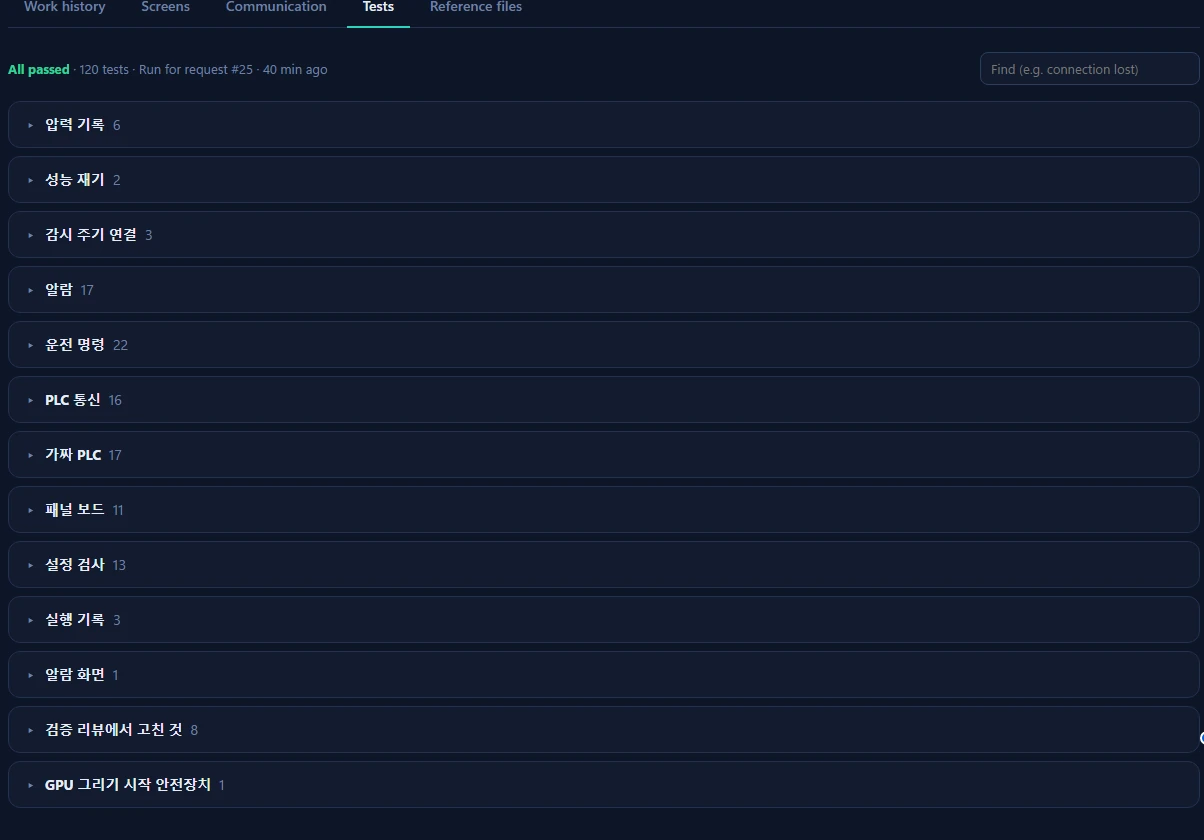
The Tests tab groups the automated tests by feature. Test names are written as descriptive sentences, so you can read what was checked without looking at the code.
What is not left to the AI
Three things are worrying about handing equipment software to an AI: it may build something else, it may say it is finished when it is not, or a wrong command may reach the machine. DV-HMI handles them like this.
- People decide what gets built. Requirements and plans are fixed only when a person approves them, and changing them takes another approval
- Tools check whether work is finished. When a piece of work ends, the command-line tool builds the program and runs the unit tests itself. If they fail, the work does not count as finished
- People handle real equipment. The AI’s tests run only against a simulator on the same PC. Starting the program and testing on real equipment is done by a person
The sample: a three-pump water supply HMI
The sample system is water supply equipment running reservoir → three pumps → check valves → pressure tank and outlet. The touch panel talks to the control panel’s PLC over Modbus TCP. The PLC is not ready yet, so the address table was defined on the HMI side first, and a simulated PLC that follows that table was built into the program. All sample screens in this post are drawn with example values.
The sample was built with a version before 0.1.27, so switching simulation and choosing the drawing mode are still on its settings screen.
Main screen and pump dialog
The main screen has a process diagram, a pressure gauge and operation controls. Water flow moves along the pipes while pumps run, and the right side changes the target pressure or switches between auto and manual. Pressing a pump in the diagram opens its dialog.
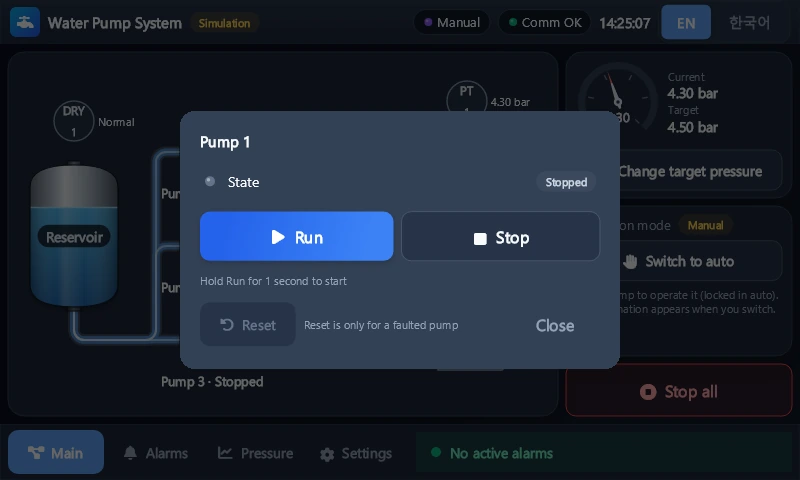
Run needs a one-second hold, and locked buttons show why they are locked. When communication is lost, values turn to -- and only Stop all can be pressed. Pressing it then tells the operator that it did not reach the PLC and to stop the pumps at the control panel.
Alarms
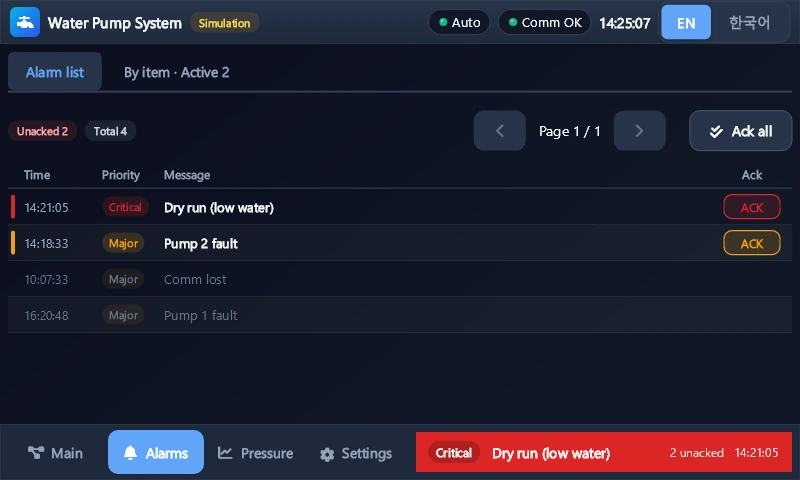
There are six alarms: dry run, pump 1, 2 and 3 fault, communication loss and record save failure. Up to 500 records stay in a file, and their acknowledged state survives a restart.
Pressure log
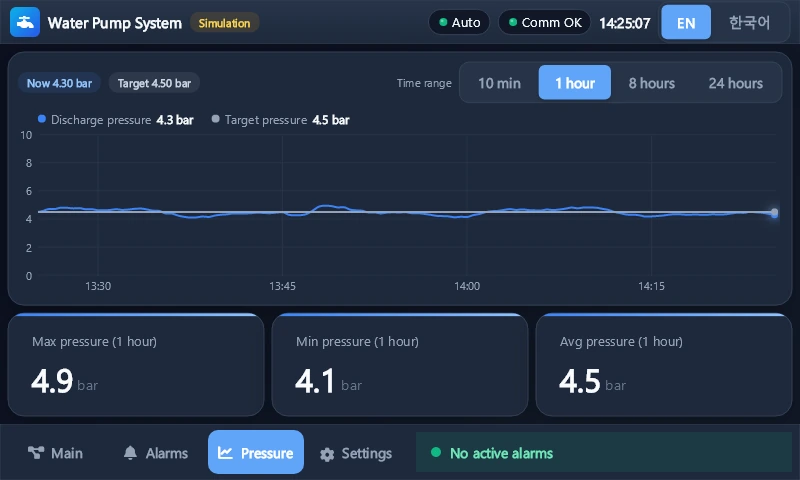
Discharge and target pressure are saved every 10 seconds for 24 hours. The time range can be 10 minutes, 1 hour, 8 hours or 24 hours, with the maximum, minimum and average for that range below. Time without communication stays blank, so the graph line is not joined across it.
Settings and simulator test
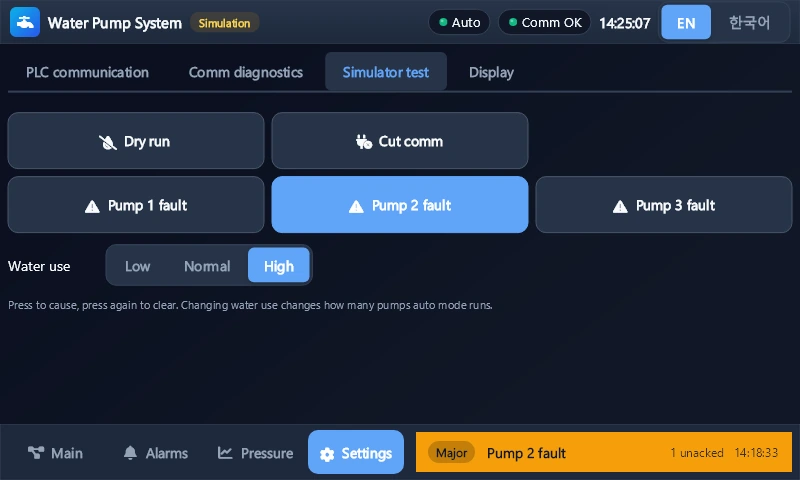
Settings has four tabs: PLC communication, communication diagnostics, simulator test and display. The Simulator test tab appears only during simulation and lets you cause a dry run, a pump fault or a communication loss on purpose to see how the screens react. The top bar always shows a marker while simulating.
How long it took
| Item | Value |
|---|---|
| Project ready to verification approved | 1 h 58 min (including answering questions and waiting for approvals) |
| Build stage | 48 min 53 s (no waiting on a person) |
| Automated tests | 120 passing |
| Address table | 15 entries |
| Work history | 25 entries (including panel fixes and later requests) |
What we fixed on the panel
Three problems came up once the program was on a panel and in use.
1. The program quit immediately on a Raspberry Pi 3 module. It exited right after starting, leaving a single PAL_SEHException line. The window code uses OpenGL ES 3.0, but the Raspberry Pi 3 graphics chip only goes up to 2.0. The program now reads the board name and uses software graphics on those boards, and it writes each startup step to its log, so you can see where it stopped. From 0.1.27, software graphics can be chosen by turning off GPU use in the deploy dialog.
2. Drawing mode changed the time to first screen a great deal. We started the same program in GPU mode and changed only the module.
| Item | Raspberry Pi 3 | Raspberry Pi 4 |
|---|---|---|
| What actually draws | Software OpenGL (CPU does the work) | Graphics chip |
| Window created to first screen | About 60 s | About 3.3 s |
| Drawing the first screen | 12,721 ms | 77.8 ms |
With water flow moving, the Raspberry Pi 3 managed 2.7 frames per second at 47% CPU, which is hard to use. The Raspberry Pi 4 averaged 30 ms per frame on a screen with nothing moving. These numbers were taken under different conditions and cannot be compared directly, and we have not yet measured the Raspberry Pi 4 with water flow moving.
3. Text overflowed its box on the English screens. Pressure log went past its menu button, and when the top bar grew, the language button on the far right was cut off. The screen library does not bundle a text font and uses the fonts installed on the device, so text width can differ between the PC preview and the panel. We shortened the long English labels and changed the top bar so that only its left group is cut when space runs out, which keeps the language button visible.
What is still open
- It has not been connected to a real PLC. The address table and auto mode behaviour are based on the simulated PLC
- The Raspberry Pi 4 still needs to be measured with water flow moving
- DV-HMI is a 0.x version under development and currently runs in the Claude desktop app (Code tab) on Windows
Getting started
You need Windows 10 or 11, the Claude desktop app and the .NET 9 SDK or later. Run these two lines in a terminal where Claude Code is installed, then restart the desktop app.
claude plugin marketplace add devinno-kr/dv-hmi-builder
claude plugin install dv-hmi@dv-hmi-builder
Open an empty folder in a new session in the Code tab and say what you want to build with dv-hmi. More details are in the GitHub repository. For the panel, see the Senvas Touch introduction.
Summary
- DV-HMI builds C# HMI programs with screens, communication, alarms and records through conversation
- The water pump sample took 1 h 58 min from project ready to verification approved, with 120 automated tests
- A panel’s graphics chip and fonts differ from a PC’s, so screens need checking again on the real device
Taking one sample through to verification approval took under two hours. Connecting it to real equipment and checking it is done by a person.
Contact
- Email: [email protected]
- Instagram: https://www.instagram.com/going.sen/
- Website: https://intosen.com/kr/consult/
Comments
Enter a nickname to leave a comment, or sign in with Google or GitHub.