
We built a screen that shows motor temperature in real time and drives relay outputs based on temperature conditions you set. It runs on an RP2350 2-inch LCD board with NTC 10K and PT1000 sensors attached, showing the current reading for each sensor and a trend graph. This post walks through the whole thing in order: connecting the sensors, calibrating the readings, and configuring the output channels and threshold temperatures.
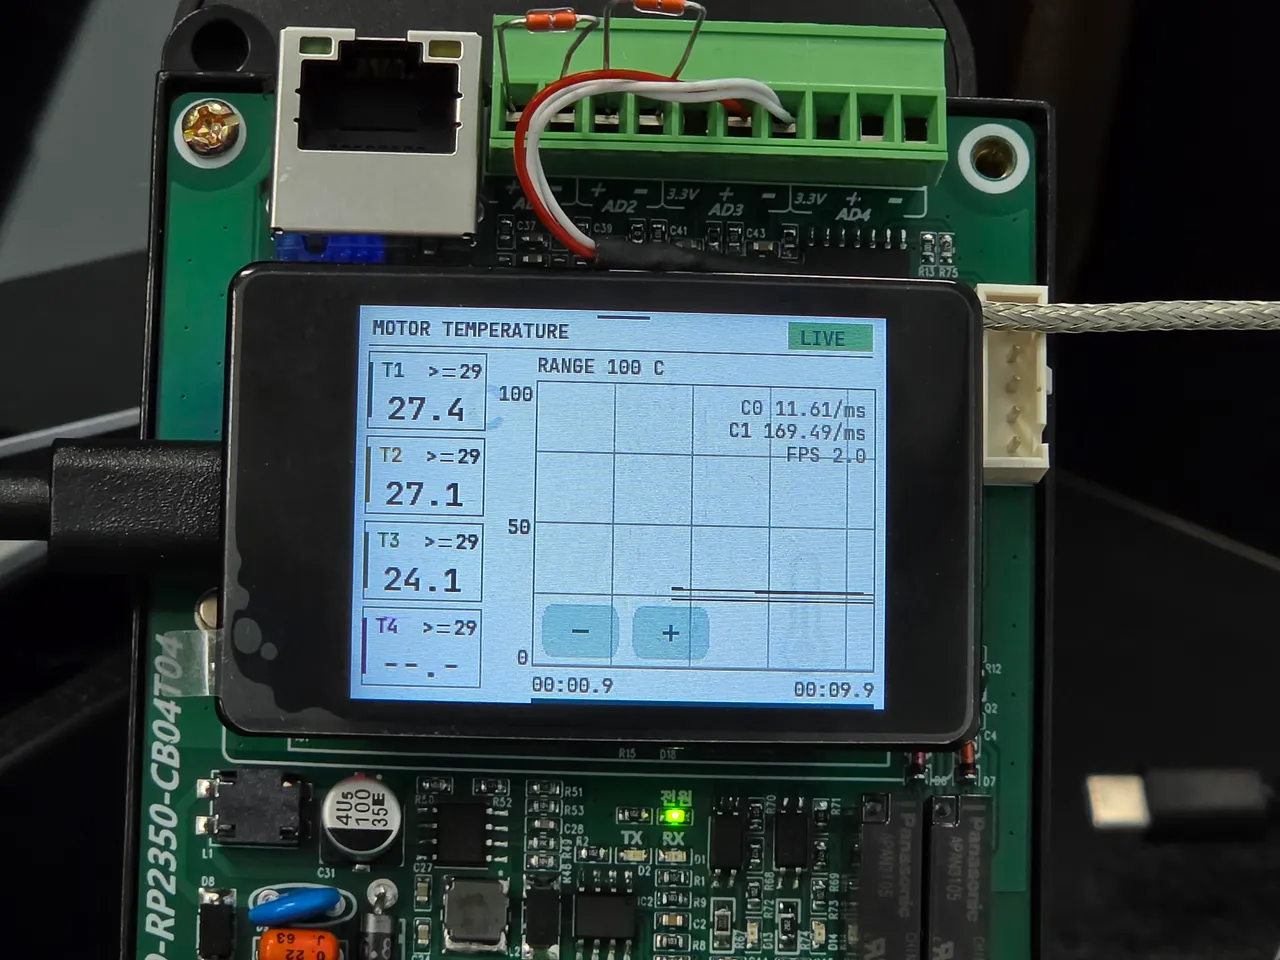
Motor temperature readings and output settings on the RP2350 LCD.
Here’s what the build does:
- Displays temperature from two NTC 10K sensors and one PT1000
- Shows each sensor’s current reading and a graph of how it changes over time
- Flags channels that have no sensor connected
- Lets you pick which temperature channel drives OUT1 and OUT2
- Sets a threshold temperature per sensor, with an above-or-below condition
Measuring motor temperature and managing output conditions on one screen
Monitoring a motor’s temperature isn’t only about reading the current value. When the temperature reaches a set point, something has to signal an external device.
So this device shows the measured temperatures on the LCD, and when the selected sensor meets its configured condition, it sends a relay output through OUT1 or OUT2. With real motor use in mind, the sensor inputs, the graph, the thresholds, and the output settings all live on a single touch screen.
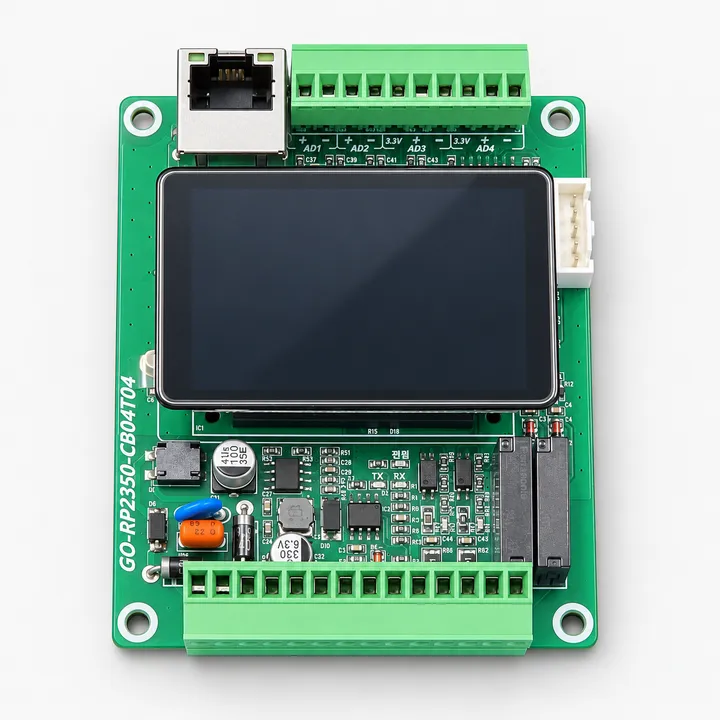
The GO-RP2350-CB04T04 board with AD inputs and relay outputs.
The GO-RP2350-CB04T04 board used here provides:
- 4 AD input channels
- RS485
- Ethernet
- 2 relay output channels (OUT1 and OUT2)
This post focuses on temperature measurement and relay output settings rather than the communication features.
RP2350 LCD, MCP3428, and temperature sensor setup
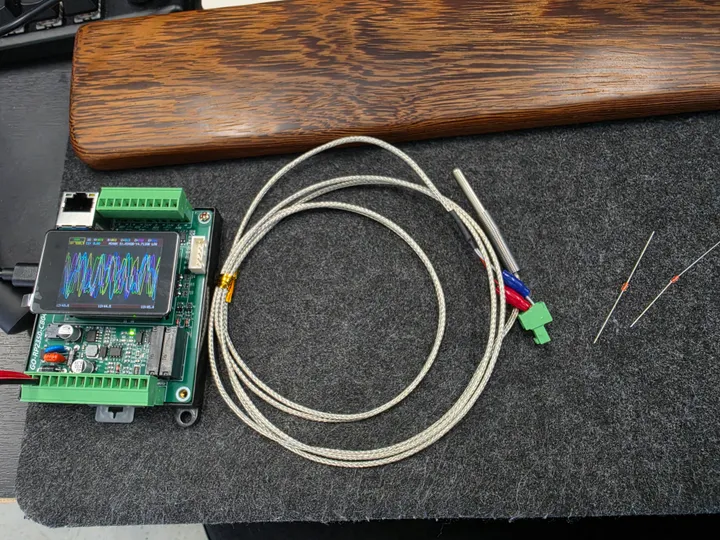
Test setup: RP2350 2-inch LCD board, MCP3428 ADC, NTC 10K and PT1000 sensors.
The temperature input stage is made of these parts:
| Part | Role |
|---|---|
| RP2350 2-inch LCD board | Displays temperature, handles the graph and settings screens |
| MCP3428 ADC | Measures the analog input from each sensor |
| NTC 10K ×2 | Temperature from resistance change |
| PT1000 ×1 | Converts the measured voltage to temperature via a reference table |
| OUT1 / OUT2 | Relay outputs driven by the configured conditions |
In the current test setup, three of the AD inputs have sensors connected. The remaining channel is handled so the screen clearly shows that nothing is attached.
How NTC 10K and PT1000 differ
Both sensors change resistance with temperature, but this device converts them to temperature in different ways.
| NTC 10K | PT1000 | |
|---|---|---|
| Count in this setup | 2 | 1 |
| Screen channel | AD1, AD2 | AD3 |
| Temperature calculation | Estimated from resistance and the B value | Measured mV reference table with a one-point correction |
| Status shown on screen | EST | CAL1 |
For the NTC 10K, temperature is calculated from the 25°C reference resistance and the B value. For the PT1000, readings are converted using a mV reference table measured on the existing input circuit, then corrected for the offset at the reference point.
Wiring NTC 10K and PT1000 to the ADC
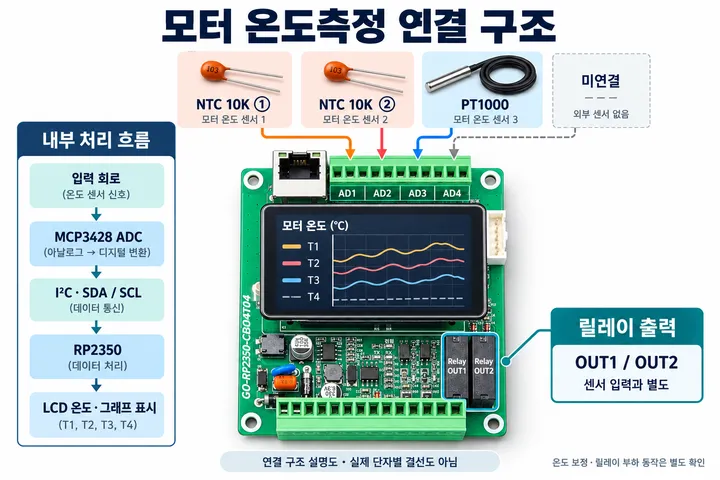
NTC 10K and PT1000 sensors connected to the MCP3428 AD inputs.
Current connections:
- AD1: NTC 10K
- AD2: NTC 10K
- AD3: PT1000
- AD4: no sensor
Sensor input and relay output are kept separate. Temperature comes in through the AD channels, and alarm conditions are chosen in the OUT1 and OUT2 settings.
Measuring and calibrating the sensor inputs
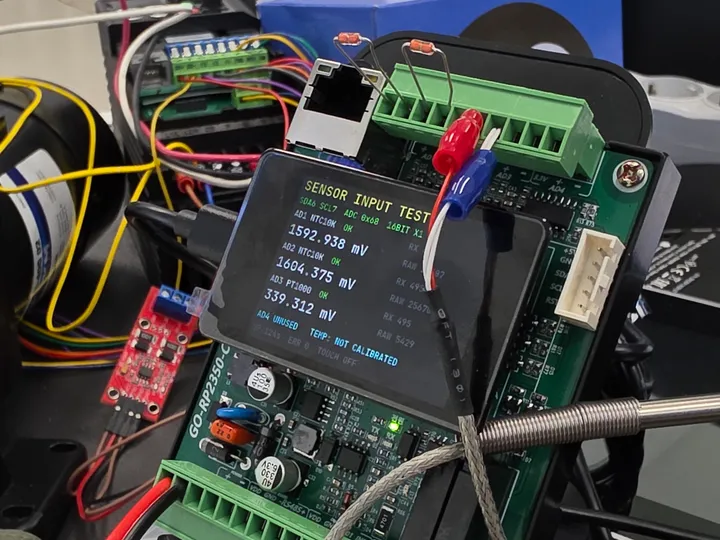
Test screen showing each sensor’s input voltage and conversion status.
After connecting the sensors, we checked that the input voltage and the calculated temperature moved together.
- NTC 10K: temperature from the measured resistance and the B value formula
- PT1000: temperature from the measured mV reference table
- PT1000 reference point: corrected with a one-point offset
Showing current temperature and a trend graph on the LCD
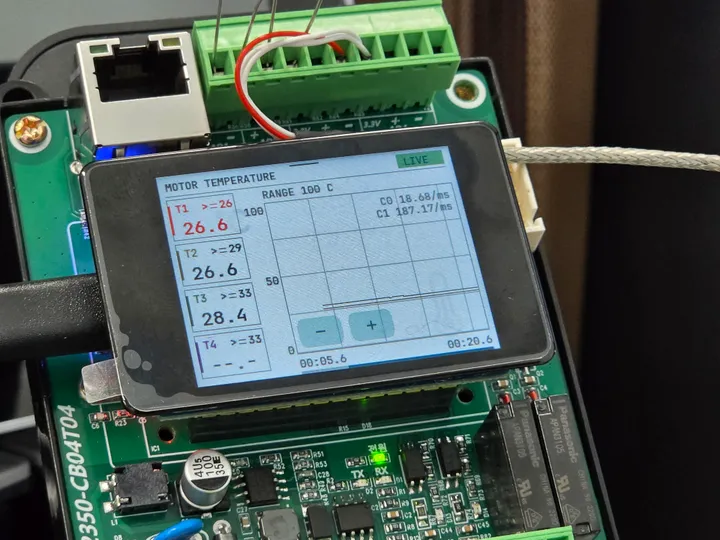
LCD dashboard with each sensor’s current temperature and its change over time.
The left side of the LCD shows the current temperature for each channel, and the graph accumulates readings as time goes on.
- Y axis: temperature
- X axis: time
- Range: 0 to 100°C
- Unconnected channel: shows
--.-
In the photo, T4 reads --.- because no sensor is connected to that channel. Rather than just printing a number, the screen makes the connection state obvious at a glance.
Setting the output channel and threshold for a motor overheat alarm
Swipe down from the top of the screen to open the settings.
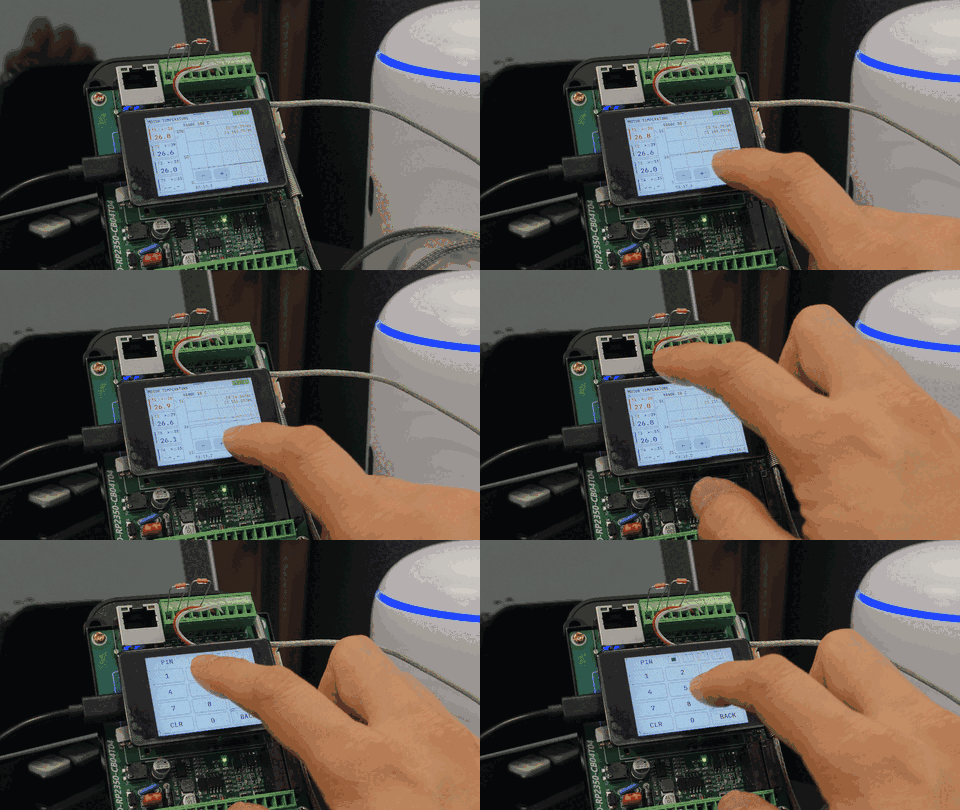
Swiping down from the main dashboard into the settings screen.
Settings are split across three pages:
- OUT1 channel and comparison condition
- OUT2 channel and comparison condition
- Target temperatures for T1 through T4
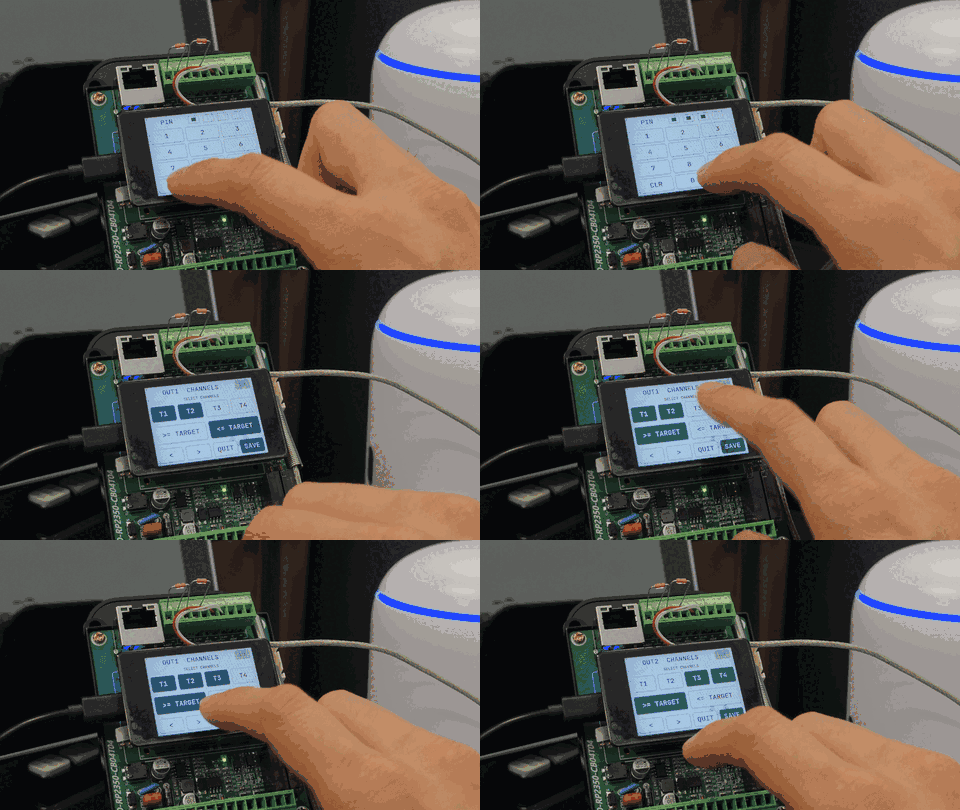
Choosing which temperature sensor channel drives OUT1 and OUT2.
On the OUT1 and OUT2 pages you pick which of T1 through T4 feeds the output condition. You also choose whether the output triggers when the temperature is at or above the target, or at or below it.
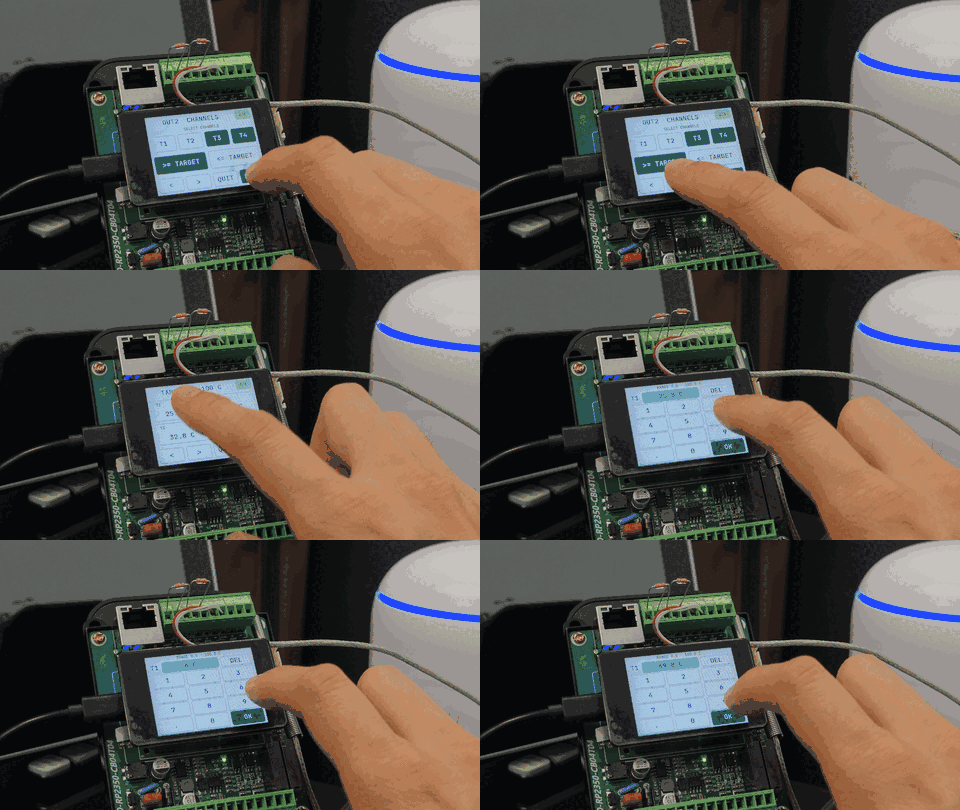
Changing the target temperature for each sensor.
The TARGETS page sets each sensor’s threshold anywhere from 0 to 100°C. The values in the video are only examples. Real settings depend on the motor, where the sensor is mounted, and the operating environment.
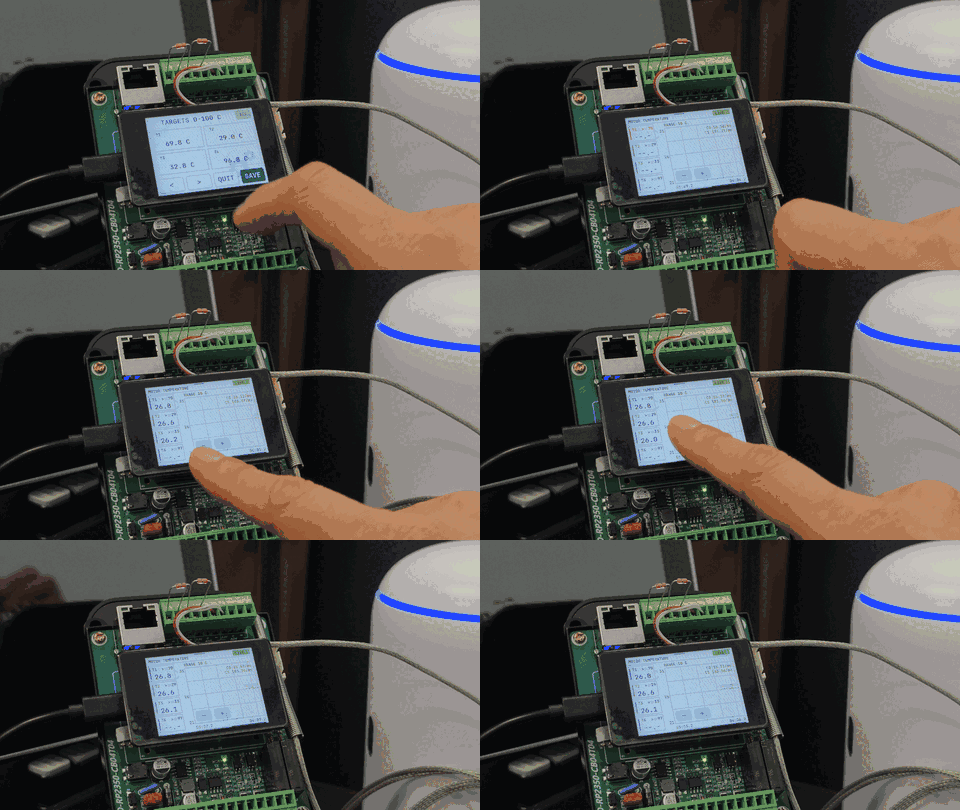
Saving the changed output conditions and targets, then returning to the dashboard.
After making changes, press SAVE to store them and QUIT to go back to the main dashboard.
How the relay output follows the set temperature
The output behavior is configured in this order:
- Choose the sensor channel for OUT1 or OUT2.
- Choose the
>= TARGETor<= TARGETcondition. - Enter that sensor’s target temperature.
- Save the settings.
- The relay output condition is decided by comparing the measured temperature against the target.
Wrap-up
Using an RP2350 2-inch LCD and the GO-RP2350-CB04T04 board, we put together a screen for motor temperature monitoring. It reads NTC 10K and PT1000 inputs, shows the current temperature and a trend graph, and lets you set OUT1 and OUT2 conditions against each sensor’s threshold.
What this stage confirmed:
- Temperature display for two NTC 10K sensors and one PT1000
- Clear indication of channels with no sensor
- Real-time temperature graph
- OUT1 and OUT2 sensor channel and comparison condition settings
- Saved target temperature per sensor
Contact
- Email: [email protected]
- Instagram: https://www.instagram.com/going.sen/
- Website: https://intosen.com/kr/consult/
Comments
Enter a nickname to leave a comment, or sign in with Google or GitHub.